Fig. 5
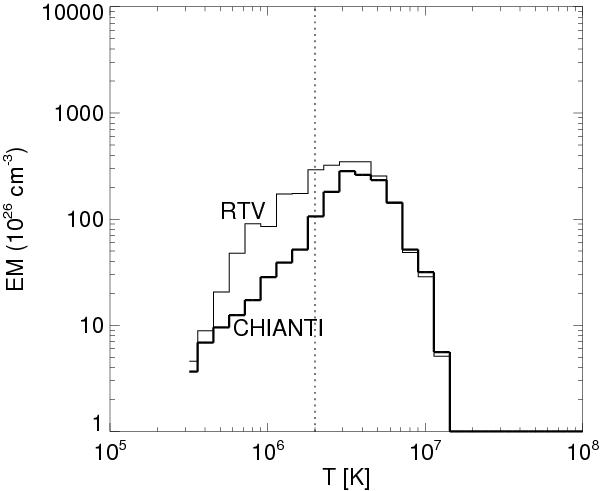
EM(T) curves obtained by averaging the emission measure distribution versus temperature over the first 2000 s of strand evolution, obtained from the simulation using the RTV (thin solid line) and the CHIANTI (thick solid line) radiative losses. The temperature of 2 MK is marked for reference (dotted vertical line).
Current usage metrics show cumulative count of Article Views (full-text article views including HTML views, PDF and ePub downloads, according to the available data) and Abstracts Views on Vision4Press platform.
Data correspond to usage on the plateform after 2015. The current usage metrics is available 48-96 hours after online publication and is updated daily on week days.
Initial download of the metrics may take a while.