Fig. 3
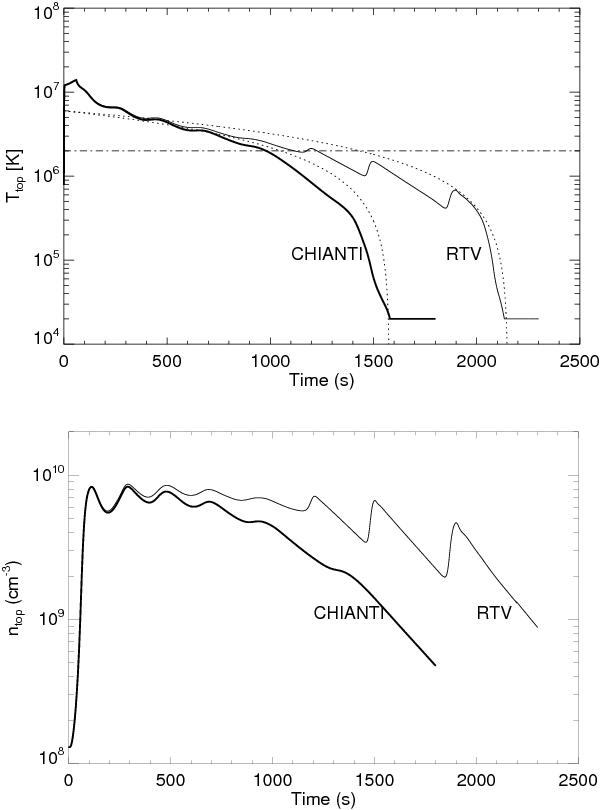
Evolution of the temperature (top) and density (bottom) at the loop apex from hydrodynamic simulations using the two different radiative-loss functions: Rosner et al. (1978) (thin solid line) and version 7 of CHIANTI (thick solid line). Results obtained with analytical approximations (Cargill 1994) are also shown (dotted lines, see text for details). The level of 2 MK is marked (dash-dotted horizontal line).
Current usage metrics show cumulative count of Article Views (full-text article views including HTML views, PDF and ePub downloads, according to the available data) and Abstracts Views on Vision4Press platform.
Data correspond to usage on the plateform after 2015. The current usage metrics is available 48-96 hours after online publication and is updated daily on week days.
Initial download of the metrics may take a while.