| Issue |
A&A
Volume 543, July 2012
|
|
|---|---|---|
| Article Number | A41 | |
| Number of page(s) | 5 | |
| Section | Stellar structure and evolution | |
| DOI | https://doi.org/10.1051/0004-6361/201219217 | |
| Published online | 25 June 2012 | |
A new soft X-ray spectral model for polars with an application to AM Herculis⋆
1 Institut für Astrophysik, Friedrich-Hund-Platz 1, 37077 Göttingen, Germany
e-mail: beuermann@astro.physik.uni-goettingen.de
2 Max-Planck-Institut für Extraterrestrische Physik, 85740 Garching b. München, Germany
Received: 13 March 2012
Accepted: 1 May 2012
We present a simple heuristic model for the time-averaged soft X-ray temperature distribution in the accretion spot on the white dwarf in polars. The model is based on the analysis of the Chandra LETG spectrum of the prototype polar AM Her and involves an exponential distribution of the emitting area vs. blackbody temperature a(T) = a0 exp( − T/T0). With one free parameter besides the normalization, it is mathematically as simple as the single blackbody, but is physically more plausible and fits the soft X-ray and far-ultraviolet spectral fluxes much better. The model yields more reliable values of the wavelength-integrated flux of the soft X-ray component and the implied accretion rate than reported previously.
Key words: accretion, accretion disks / novae, cataclysmic variables / stars: individual: AM Her / X-rays: binaries
© ESO, 2012
1. Introduction
In the “polar” subtype of cataclysmic binaries, a magnetic white-dwarf mass accretes matter from its Roche-lobe filling main-sequence companion. Part of the energy released in the process appears as soft X-ray emission of the heated photosphere in the accretion spot(s) near the magnetic pole(s) of the white dwarf. The emitted spectrum is conventionally modeled as a single blackbody with a temperature around 30 eV (e.g. Ramsay et al. 1996; Ramsay & Cropper 2004), although on theoretical grounds the source is not expected to be isothermal. Constructing a viable model requires observations that extend from the soft X-ray into the far-ultraviolet regime with sufficient spectral resolution and good counting statistics, preferably from a source that exhibits a single accretion spot. A suitable source is the prototype polar AM Her in its high state, when it is the brightest soft X-ray source in the sky. The first high-resolution soft X-ray spectrum of AM Her was taken by Paerels et al. (1996) with the EUVE short-wavelength spectrometer. Because of the limited spectral coverage, however, they retained the single-blackbody assumption. Substantially improved high-resolution soft X-ray spectra of AM Her became available with the Low Energy Transmission Grating Spectrometer (LETGS) on board of Chandra (Burwitz et al. 2002; Trill 2006) with the High Resolution Camera for Spectroscopy (HRC-S) as detector. In this paper, we analyze the orbital mean LETG spectrum of AM Her taken in September 2000.
Intermittent heating and cooling determines the mean temperature distribution averaged over time and the spatial coordinates in the spot. The distribution ranges from the photospheric temperature to several tens of eV (see Beuermann et al. 2008, for the case of AM Her). We determined the mean temperature distribution for AM Her by unfolding the time-averaged Chandra LETG spectrum of AM Her. Our model employs a quasi-continuous distribution of blackbodies (BB) that is described by a single free parameter besides the common normalization. Mathematically, this model is as simple as the single blackbody. We fitted the LETG spectrum of AM Her by adding the thermal emission of the post-shock cooling flow to the soft X-ray component. A similar model was adopted by Traulsen et al. (2010) for the XMM-Newton spectrum of the polar AI Tri.
2. Observations of AM Her and data analysis
We analyzed the Chandra observation 645 of 30 September 2000, which was performed with the LETG and the HRC-S as detector and lasted 24 ks. The data cover the wavelength range 4–120 Å (0.1–3.0 keV) with a spectral resolution of Δλ(FWHM) ≃ 0.05 Å. The time-dependent spectra were analyzed by Burwitz et al. (2002) and only the time-averaged mean is considered here. The spectrum was re-binned from its original resolution of 0.05 Å to a logarithmic wavelength scale with 100 bins per decade, which averages over the multitude of faint emission and absorption features but leaves the major spectral emission lines intact (Fig. 1, left panel, solid green curve). Absolute spectral fluxes were derived using the LETGS effective areas given in the Chandra calibration files CALDB 4.4.71. We re-analyzed, in addition, the ROSAT PSPC observation rp300067 of 12/13 April 1991 (Gänsicke et al. 1995; Ramsay et al. 1996; Beuermann et al. 2008). This spectrum contains 1.3 million counts and has a statistical error near 0.20 keV of 0.39% per 10-eV PSPC channel. Both data sets provide nearly full orbital phase coverage. On both occasions, AM Her was in its normal accretion mode (Mazeh et al. 1986) with visual AAVSO magnitudes at orbital maximum of V ≃ 13.3 (Chandra) and 13.2 (ROSAT), respectively. The PSPC spectrum was analyzed using the detector response matrix DRMPSPC_AO1c (Beuermann 2008).
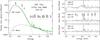 |
Fig. 1 Left: mean Chandra LETG spectrum of September 2000 reduced to the first diffraction order (green curve) and fitted with the EXP+CF model (upper black solid curve, see text). Right, top: residuals for the 1BB+CF model represented by the data/model flux ratio. The reduced χ2 value refers to the energy range of 0.10–0.50 keV. Center: same for the 2BB+CF model. The twelve spectral bins excluded in the fits are indicated by tick marks. Bottom: same for the EXP+CF model displayed in the left panel. |
3. Model assumptions
Our model includes two dominant spectral components, thermal hard X-rays from the post-shock cooling flow (CF) and soft X-rays produced by various modes of reprocessing of the energy transported from the CF into the atmosphere of the white dwarf (Kuijpers & Pringle 1982; Frank et al. 1988; Gänsicke et al. 1995; König et al. 2006). In addition, a small component of residual emission lines (RL) exists that is not explained by the CF model and may be due to photoionization (Mukai et al. 2003; Girish et al. 2007). We describe the soft X-ray component by single and multi-temperature variants of the blackbody model (1BB, 2BB, 10BB, EXP), further explained in the next section.
The thermal X-ray emission of the CF is described as optically thin free-free and bound-free emission for a plasma of solar abundances, employing Mekal spectra. This model neglects the influence that cyclotron emission exerts on the temperature distribution and is appropriate for AM Her as a low-field polar (Fischer & Beuermann 2001). Depending on the specific accretion rate, the shock may be free-standing above the atmosphere or buried in the photosphere and a variety of such columns may coexist in the spot at any given time. For matter of solar composition, the shock temperature is Ts = 32.2 (M/M⊙)/(R/109 cm) keV, or Ts = 33.5 keV for the white dwarf in AM Her with mass M = 0.78 M⊙ and radius R = 7.5 × 108 cm (Gänsicke et al. 2006). X-rays emitted from buried columns can escape only by passing through atmospheric material with column densities ranging up to NH ≳ 1025 H-atoms cm-2 (Beardmore et al. 1995; Ishida et al. 1997; Christian 2000). We include a partial absorber with a column density NH,int and a covering fraction fc, but disregard the reflection component, which becomes prominent at higher photon energies (van Teeseling et al. 1996). This simplified treatment is adequate for the limited energy range covered by the LETGS, but can not be expected to provide an accurate measure of the bolometric flux contained in the hard X-ray component (see Sect. 4.4).
We included photoabsorption by an interstellar column density NH of partially ionized matter with solar abundances and parts of the metals condensed into dust. The ionization fractions of hydrogen and helium, xH and xHe, are parameters of the fit, with the resulting value of NH depending on xH. Most results are quoted for xH = 0.25 and xHe = 0.40, as derived for near-solar interstellar space (see Beuermann et al. 2006, their Sect. 4.2). We included the NeVI absorption edges at 78 and 85 Å detected in the EUVE spectrum of AM Her (Paerels et al. 1996), which are either of interstellar or circumbinary origin. The respective optical depths, τ78 and τ85, are free parameters of the fit.
Parameters of spectral fits to the mean September 2000 Chandra LETG and April 1991 ROSAT PSPC spectra of AM Her.
4. Results
The CF component reproduces the 0.6–3.0 keV part of the LETG spectrum and accounts for the hydrogen-like emission lines of nitrogen, oxygen, magnesium, neon, silicon, and sulphur, but largely lacks the helium-like triplets and some other lines. We excluded, therefore, twelve of 151 spectral bins from the fit that contain these lines and represent the RL component (marked by ticks in Fig. 1, center right panel). The fit yields a covering fraction fc ≃ 0.70, implying that 30% of the CF component escape unattenuated and 70% pass through an internal absorber of NH,int ≃ 3.1 × 10²³ H-atoms cm-2.
Interstellar absorption by a column density NH acts on both, the soft and hard X-ray components. For our standard values xH = 0.25 and xHe = 0.40, the derived column densities in Table 1 exceed the value of (3.0 ± 1.5) × 1019 H-atoms cm-2 derived from Lyα absorption in the FUV spectrum of AM Her (Gänsicke et al. 1995). The fit value of NH depends, however, on xH and for our final model the Lyα value is reproduced for xH = 0.68 ± 0.18. The true value of the degree of ionization along the line of sight to AM Her is not well known and we can not exclude such a high value. We note that AM Her itself does not add much to the mean ionization along the path, because its Stroemgren radius amounts only to a few pc for a mean atomic hydrogen density of 0.25 hydrogen atoms cm-2. Our fits confirm the absorption edges at 78 and 85 Å found by Paerels et al. (1996), although with smaller optical depths τ78 ≃ 0.05 and τ85 ≃ 0.11.
Obtaining a formal χ2 of the fit to the LETG spectrum requires an assessment of the errors of the binned spectral fluxes. This is not straightforward, because faint emission and absorption lines are spread over the entire wavelength range (Burwitz et al. 2002; Trill 2006). Since these features are not accounted for by our model, we defined the wavelength-dependent “error” for the χ2 calculation by a polynomial fit to the rms deviations between data and the best model vs. wavelength, with the twelve spectral bins defining the RL component excluded. This fixes the residual  of the best-fitting models near unity. The adopted error varies from 5% of the first-order flux at 0.1 keV to 13% at 3.0 keV.
4.1. Modeling the soft X-ray component of AM Her
1BB+CF model: the single-blackbody model utterly fails to fit the low-energy part of the LETG spectrum. Our fit yields an unacceptable reduced  (Table 1). The residuals, in the form of the ratio data/model, are displayed in Fig. 1 (top right panel). The model involves two free parameters for the soft X-ray component, three parameters for the CF component, and three parameters describing the interstellar absorption (NH, τ78 and τ85, with xH and xHe fixed). The fit parameters and the derived fluxes are summarized in Table 1.
2BB+CF model: adding a second blackbody (and two free parameters) significantly improves the fit with best-fit temperatures of 24.7 and 41.5 eV. The residuals of the fit are displayed in the center right panel of Fig. 1. The fact that the 2BB+CF model fits the LETG spectrum so well might suggest a dichotomy in the blackbody temperature of the accretion spot. On theoretical grounds, we consider it more plausible, however, that the result indicates the presence of a wider range of blackbody temperatures in the time-averaged spectrum.
 |
Fig. 2 Projected emitting area per eV on the white dwarf in AM Her and integrated blackbody flux per eV at the Earth as a function of the blackbody temperature kT for the 10BB+CF model. The solid line represents the EXP model of Eq. (1) (see text). |
10BB+CF model: we study the temperature distribution in more detail, by introducing a grid of 10 fixed blackbody temperatures, which covers the interval 10–60 eV in 5 eV steps with kTn = 2.5 (2n − 1) eV and n = 3 to 12. The fit turns out to be stable if a small amount of regularization in the normalizations is introduced. We left the normalizations for nine of the ten bins free and prevented a loose-end excursion in the first bin by tying it to the trend defined by the other normalizations. Figure 2 shows the best-fit projected emitting area per eV, a(T), and the corresponding unabsorbed integrated blackbody flux per eV, fbb(T). The latter peaks in the 15–20 eV bin and substantial contributions are expected to exist at still lower temperatures. The observed soft X-ray spectral flux lacks these low-temperature contributions because of interstellar absorption. Only a meagre 1.2% of the integrated observed flux originate from kT < 15 eV. The value of χ2 is slightly improved for the 10BB model compared with the 2BB case, but deteriorates from 1.03 to 1.13 (see Table 1), because the individual normalizations are not independent of each other. The errors in Fig. 2 are estimates from runs with different levels of regularization of the first bin. We conclude that the emitting area on the white dwarf decreases continuously with increasing temperature, although with ten free parameters the 10BB model is clearly overdetermined.
EXP+CF model: for kT > 15 eV, the projected emitting area a(T) of the 10BB model can be approximated by an exponential  (1)shown as the solid line in Fig. 2. For a distance of AM Her of 80 pc (Thorstensen 2003; Beuermann 2006), we find a 0 = 1.17 × 1017 cm2 eV-1 and kT0 = 3.46 eV. The standard version of our EXP model utilizes the full temperature range and fits the soft X-ray emission of AM Her excellently with only one free parameter besides the normalization. Hence, the EXP model is mathematically as simple as the single blackbody. A fit using this model is displayed in Fig. 1 (left panel and bottom right panel). The parameters and derived fluxes are given in Table 1.
The EXP model is attractive, because it provides a heuristic description of the time-averaged mean temperature distribution in the photospheric accretion spot on the white dwarf in AM Her. The theory of the heating and cooling processes in the individual subcolumns of the spot is not yet well developed (e.g. König et al. 2006) and the present analysis may help to improve it.
As shown in the Appendix, some key quantities of the EXP model can be expressed analytically. For the temperature range from kT = 15 eV to infinity (or ~100 eV) and a0 and kT0 as derived from the best fit, the projected area of the soft X-ray emitting spot is A ⊥ ,X = 4.8 × 1015 cm2 at d = 80 pc, corresponding to 0.07% of the surface area of the white dwarf. For still lower temperatures, the spot area increases, but can no longer be determined from the fit to the LETG spectrum alone.
4.2. The FUV flux of AM Her
In the EXP model, temperatures kT ≲ 15 eV contribute little to the soft X-ray flux detected with the LETGS, but produce a sizeable fraction of the FUV flux. In principle, the run of a(T) at low temperatures can be obtained from FUV observations, subject, however, to substantial observational and theoretical uncertainties. Observationally, the FUV flux is dominated by emission from the accretion stream, with the Balmer (and presumably the Lyman) jump strongly in emission. The spot contribution, on the other hand, is probably characterized by rapid variability and the lack of strong line emission. Whether it shows the Lyman jump in emission or absorption remains uncertain (Gänsicke et al. 1995, 1998; Greeley et al. 1999; Hutchings et al. 2002; König et al. 2006). For simplicity, we retain the multi-temperature blackbody model.
The mean orbital spectral flux of AM Her at 930 Å was measured with the shuttle-based Hopkins Ultraviolet Telescope (HUT) in March 1995 (Greeley et al. 1999) and with the Far Ultraviolet Spectroscopic Explorer (FUSE) in June 2000 (Hutchings et al. 2002; Gänsicke et al. 2006) as f930 ≃ 3.5 × 10⁻¹³ and 2.6 × 10⁻¹³ erg cm-2 s-1 Å-1, when the mean AAVSO visual magnitudes of AM Her were V ≃ 13.2 and 13.3, respectively. Greeley et al. (1999) reported the presence of a rapidly fluctuating “flare minus non-flare” component (FNF) with a mean-orbital 930 Å spectral flux of 1.3 × 10⁻¹³ erg cm-2 s-1 Å-1. Corrected for reddening, the quoted fluxes become f930 ≃ 4.0 × 10⁻¹³ erg cm-2 s-1 Å-1 (HUT), 3.0 × 10⁻¹³ erg cm-2 s-1 Å-1 (FUSE), and 1.5 × 10⁻¹³ erg cm-2 s-1 Å-1 (HUT, FNF). We compare these observed fluxes with the predictions of the spot models presented in the last section. We do not correct for the orbital modulations of the individual components, because the observations are not simultaneous, the individual high states have different flux levels, and the blackbody assumption adds to the uncertainties.
 |
Fig. 3 Top: 2BB, LIN, and CF components of the September 2000 Chandra LETG spectrum of AM Her fitted to the mean April 1991 PSPC spectrum. Bottom: residuals of the fit based on the purely statistical errors of the PSPC spectrum. |
The EXP model yields a 930 Å spectral flux f930 = 8.0 × 10⁻¹³ erg cm-2 s-1 Å-1 if integrated over all temperatures and  = 1.35 × 10⁻¹³ erg cm-2 s-1 Å-1 for kT > 15 eV. The former exceeds the reddening-corrected total HUT and FUSE 930 Å fluxes by a moderate factor of two, while the latter agrees approximately with the lower HUT FNF flux. Taken at face value, these numbers suggest that the EXP model overestimates the emitting area at kT < 15 eV. Reducing a(T) by a factor of four at 5 eV (dashed line in Fig. 2) yields an acceptable f930 = 4.06 × 10⁻¹³ erg cm-2 s-1 Å-1, while = 1.33 × 10⁻¹³ erg cm-2 s-1 Å-1 stays practically unchanged. These are the numbers included in Table 1. Since the inherent uncertainties in this comparison may easily amount to a factor of two, we conclude, that the EXP model or its variant with a reduced emitting area for kT < 15 eV provide an adequate description of the FUV flux expected from the entire hot polar cap of AM Her. The fraction of the flux that arises from kT > 15 eV, agrees with Greeley’s FNF component, suggesting that it represents the Rayleigh-Jeans part of the spectral flux emitted by the proper accretion spot. For comparison, the 1BB model fails to predict the FUV flux by more than an order of magnitude (Table 1).
4.3. Fitting the ROSAT PSPC spectrum
Finally, we show that the EXP+CF+RL model fits the April 1991 ROSAT PSPC spectrum, too. We allowed for small corrections to the nominal calibration of the PSPC as prescribed by Prieto et al. (1996) and Beuermann (2008). There are four free parameters of the fit, two for the EXP component and two for the normalizations of the numerically provided RL and total CF components taken from the fit to the Chandra LETG spectrum. The excellent fit is shown in Fig. 3 and the derived parameters are listed in Table 1. For the PSPC fit, the normalization of the EXP component is almost identical to that of the LETG, while the CF-component is 24% weaker and the RL component 27% stronger, differences that are easily accounted for by time variability of the source (Stella et al. 1986; Trill 2006). An acceptable fit to the PSPC spectrum is also obtained for the 1BB+CF+RL model (Table 1), demonstrating that the higher resolved LETG spectrum is needed to define a superior model for the soft X-ray emission of AM Her.
4.4. Accretion luminosity and accretion rate
Soft and hard X-ray emission are the dominant accretion-induced radiation components in AM Her. Table 2 summarizes their integrated fluxes, which refer to the bright phase (magnetic phases φmagn = 0.2−1.0) and exceed the mean orbital fluxes in Table 1 by about 22%. The fluxes F are converted to luminosities L = ηπd2F, assuming the geometry factors η given in the table and a distance d = 80 pc (Thorstensen 2003; Beuermann 2006). The ultraviolet flux from the heated polar cap of the white dwarf is not included, because it is created by the downward hard X-ray and cyclotron fluxes (Gänsicke et al. 1995, 1998; König et al. 2006) and is already accounted for by the choice of the geometry factors. The factor 3.3π for the hard X-rays accounts for the reflection albedo (van Teeseling et al. 1996). We adopt here Christian’s (2000) integrated hard X-ray flux. The total accretion-induced luminosity then is Lacc = 2.5 × 1033 erg s-1 and the implied accretion rate for a white dwarf with a mass of 0.78 M⊙ and a radius of 7.5 × 108 cm (Gänsicke et al. 2006) is Ṁ = 2.9 × 10⁻¹⁰ M⊙ yr-1. This result is similar to the PSPC result of Beuermann et al. (2008), but is placed here on more secure grounds, being based on the much better resolved Chandra LETG spectrum. The luminosity emitted as soft X-rays exceeds the sum of the hard X-ray and the cyclotron luminosities by a factor LsoftX/(LhardX + Lcyc) ≃ 4.3 ± 2.0. The conservatively estimated error accounts for a ~30% uncertainty in the hard X-ray flux, the remaining error in the bolometric soft X-ray flux, and variations between the individual high states in which the measurements were taken. A moderate dominance of soft X-rays is clearly present and is easily explained by the concept of “buried shocks” (Kuijpers & Pringle 1982; Frank et al. 1988).
Bright-phase high-state bolometric energy fluxes of AM Her.
5. Conclusions
We have presented a new model for the soft X-ray emission of polars, which is superior and physically more plausible than the frequently employed single-blackbody model. Our model provides an excellent fit to the high-resolution Chandra LETG spectrum of AM Her and fits the ROSAT PSPC spectrum equally well. Without further assumptions, the model provides also an explanation of the rapidly varying FUV spectral flux of AM Her (Greeley et al. 1999), which may represent the Rayleigh Jeans tail of the soft X-ray component. On theoretical grounds, the intermittent heating and subsequent cooling of individual segments of the accretion spot must lead to a spatially and temporally averaged temperature distribution in the spot, which extends from several tems of eV down to the photospheric temperature. Our model provides a first approximation to this temperature distribution, using a single-parameter fit to the soft X-ray spectral energy distribution. The new model is mathematically as simple as the isothermal single-blackbody model and physically more plausible.
The calibration files can be found at http://cxc.harvard.edu/caldb/ downloads/Release_notes/CALDB_v4.4.7.html. For a general approach see also Beuermann et al. (2006).
Acknowledgments
We thank the anonymous referee for useful comments, which helped to improve the presentation. This research has made use of data obtained from the Chandra Data Archive under ObsId 00645, and software provided by the Chandra X-ray Center (CXC).
References
- Bailey, J., Ferrario, L., & Wickramasinghe, D. T. 1991, MNRAS, 251, 37 [Google Scholar]
- Beardmore, A. P., Done, C., Osborne, J. P., & Ishida, M. 1995, MNRAS, 272, 749 [NASA ADS] [Google Scholar]
- Beuermann, K. 2006, A&A, 460, 783 [NASA ADS] [CrossRef] [EDP Sciences] [Google Scholar]
- Beuermann, K. 2008, A&A, 481, 919 [NASA ADS] [CrossRef] [EDP Sciences] [Google Scholar]
- Beuermann, K., Burwitz, V., & Rauch, T. 2006, A&A, 458, 541 [NASA ADS] [CrossRef] [EDP Sciences] [Google Scholar]
- Beuermann, K., El Kholy, E., & Reinsch, K. 2008, A&A, 481, 771 [NASA ADS] [CrossRef] [EDP Sciences] [Google Scholar]
- Burwitz, V., Reinsch, K., Haberl, F., Gänsicke, B. T., & Predehl, P. 2002, ASP Conf. Ser., 261, 137 [NASA ADS] [Google Scholar]
- Christian, D. J. 2000, AJ, 119, 1930 [NASA ADS] [CrossRef] [Google Scholar]
- Fischer, A., & Beuermann, K. 2001, A&A, 373, 211 [NASA ADS] [CrossRef] [EDP Sciences] [Google Scholar]
- Frank, J., King, A. R., & Lasota, J.-P. 1988, A&A, 193, 113 [NASA ADS] [Google Scholar]
- Gänsicke, B. T., Beuermann, K., & de Martino, D. 1995, A&A, 303, 127 [NASA ADS] [Google Scholar]
- Gänsicke, B. T., Hoard, D. W., Beuermann, K., Sion, E. M., & Szkody, P. 1998, A&A, 338, 933 [NASA ADS] [Google Scholar]
- Gänsicke, B. T., Long, K. S., Barstow, M. A., & Hubeny, I. 2006, ApJ, 639, 1039 [NASA ADS] [CrossRef] [Google Scholar]
- Girish, V., Rana, V. R., & Singh, K. P. 2007, ApJ, 658, 525 [NASA ADS] [CrossRef] [Google Scholar]
- Greeley, B. W., Blair, W. P., Long, K. S., & Raymond, J. C. 1999, ApJ, 513, 491 [NASA ADS] [CrossRef] [Google Scholar]
- Hutchings, J. B., Fullerton, A. W., Cowley, A. P., & Schmidtke, P. C. 2002, AJ, 123, 2841 [NASA ADS] [CrossRef] [Google Scholar]
- Ishida, M., Matsuzaki, K., Fujimoto, R., Mukai, K., & Osborne, J. P. 1997, MNRAS, 287, 651 [NASA ADS] [Google Scholar]
- König, M., Beuermann, K., & Gänsicke, B. T. 2006, A&A, 449, 1129 [NASA ADS] [CrossRef] [EDP Sciences] [Google Scholar]
- Kuijpers, J., & Pringle, J. E. 1982, A&A, 114, L4 [NASA ADS] [Google Scholar]
- Mazeh, T., Kieboom, K., & Heise, J. 1986, MNRAS, 221, 513 [NASA ADS] [Google Scholar]
- Mukai, K., Kinkhabwala, A., Peterson, J. R., Kahn, S. M., & Paerels, F. 2003, ApJ, 586, L77 [NASA ADS] [CrossRef] [Google Scholar]
- Paerels, F., Hur, M. Y., Mauche, C. W., & Heise, J. 1996, ApJ, 464, 884 [NASA ADS] [CrossRef] [Google Scholar]
- Prieto, M. A., Hasinger, G., & Snowden, S. L. 1996, A&AS, 120, 187 [NASA ADS] [CrossRef] [EDP Sciences] [Google Scholar]
- Ramsay, G., & Cropper, M. 2004, MNRAS, 347, 497 [NASA ADS] [CrossRef] [Google Scholar]
- Ramsay, G., Cropper, M., & Mason, K. O. 1996, MNRAS, 278, 285 [NASA ADS] [Google Scholar]
- Stella, L., Beuermann, K., & Patterson, J. 1986, ApJ, 306, 225 [NASA ADS] [CrossRef] [Google Scholar]
- Thorstensen, J. R. 2003, AJ, 126, 3017 [NASA ADS] [CrossRef] [Google Scholar]
- Traulsen, I., Reinsch, K., Schwarz, R., et al. 2010, A&A, 516, A76 [NASA ADS] [CrossRef] [EDP Sciences] [Google Scholar]
- Trill, M. 2006, Masters Thesis, Munich University [Google Scholar]
- van Teeseling, A., Kaastra, J. S., & Heise, J. 1996, A&A, 312, 186 [NASA ADS] [Google Scholar]
Appendix A: Analytical expressions
Let the emitting area be a(T) = a0 exp( − T/T0) and the emitted spectrum at temperature T be a blackbody. For a temperature interval of T1 to infinity and x = T/T0, the projected area of the spot is  (A.1)with Ω the solid angle subtended by the spot and d the distance. With
  , where σ is the Stefan-Boltzmann constant, the integrated unabsorbed blackbody flux at the Earth is
 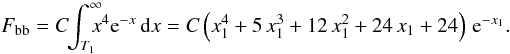 (A.2)The mean spot temperature weighted by the unabsorbed blackbody flux is
 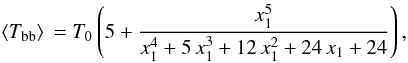 (A.3)which assumes its minimal value ⟨ Tbb ⟩ = 5T0 if the exponential extends to zero temperature.
All Tables
Parameters of spectral fits to the mean September 2000 Chandra LETG and April 1991 ROSAT PSPC spectra of AM Her.
All Figures
|
Fig. 1 Left: mean Chandra LETG spectrum of September 2000 reduced to the first diffraction order (green curve) and fitted with the EXP+CF model (upper black solid curve, see text). Right, top: residuals for the 1BB+CF model represented by the data/model flux ratio. The reduced χ2 value refers to the energy range of 0.10–0.50 keV. Center: same for the 2BB+CF model. The twelve spectral bins excluded in the fits are indicated by tick marks. Bottom: same for the EXP+CF model displayed in the left panel. |
| In the text | |
|
Fig. 2 Projected emitting area per eV on the white dwarf in AM Her and integrated blackbody flux per eV at the Earth as a function of the blackbody temperature kT for the 10BB+CF model. The solid line represents the EXP model of Eq. (1) (see text). |
| In the text | |
|
Fig. 3 Top: 2BB, LIN, and CF components of the September 2000 Chandra LETG spectrum of AM Her fitted to the mean April 1991 PSPC spectrum. Bottom: residuals of the fit based on the purely statistical errors of the PSPC spectrum. |
| In the text | |
Current usage metrics show cumulative count of Article Views (full-text article views including HTML views, PDF and ePub downloads, according to the available data) and Abstracts Views on Vision4Press platform.
Data correspond to usage on the plateform after 2015. The current usage metrics is available 48-96 hours after online publication and is updated daily on week days.
Initial download of the metrics may take a while.