Fig. 1
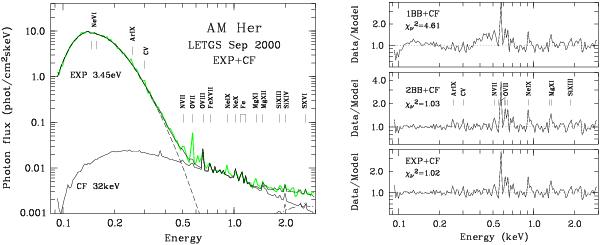
Left: mean Chandra LETG spectrum of September 2000 reduced to the first diffraction order (green curve) and fitted with the EXP+CF model (upper black solid curve, see text). Right, top: residuals for the 1BB+CF model represented by the data/model flux ratio. The reduced χ2 value refers to the energy range of 0.10–0.50 keV. Center: same for the 2BB+CF model. The twelve spectral bins excluded in the fits are indicated by tick marks. Bottom: same for the EXP+CF model displayed in the left panel.
Current usage metrics show cumulative count of Article Views (full-text article views including HTML views, PDF and ePub downloads, according to the available data) and Abstracts Views on Vision4Press platform.
Data correspond to usage on the plateform after 2015. The current usage metrics is available 48-96 hours after online publication and is updated daily on week days.
Initial download of the metrics may take a while.