Fig. 6
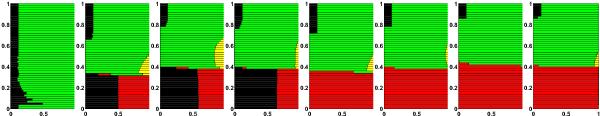
Volume fractions (horizontal axis) of solid iron (black), liquid iron (red), solid silicates (green) and liquid silicates (yellow) as function of the relative radius r/Rp(t) (vertical axis). Plotted data show the internal structures at the time when the core formation is completed, i.e. no more iron separation from a matrix with silicates (in the case P1, for which no core forms, the final structure is shown at 15 Ma). Note also that after iron melt percolates downwards and a core forms, some of the iron recrystallises again with decreasing temperature. From left to right the panels correspond to the cases P1–P4 with TL,Fe = 1700 K and PL1–PL4 with TL,Fe = 1233 K. See Table 9 for further information.
Current usage metrics show cumulative count of Article Views (full-text article views including HTML views, PDF and ePub downloads, according to the available data) and Abstracts Views on Vision4Press platform.
Data correspond to usage on the plateform after 2015. The current usage metrics is available 48-96 hours after online publication and is updated daily on week days.
Initial download of the metrics may take a while.