| Issue |
A&A
Volume 543, July 2012
|
|
|---|---|---|
| Article Number | A58 | |
| Number of page(s) | 14 | |
| Section | Stellar structure and evolution | |
| DOI | https://doi.org/10.1051/0004-6361/201219122 | |
| Published online | 27 June 2012 | |
CD-62°1346: an extreme halo or hypervelocity CH star?⋆,⋆⋆
1 Observatório Nacional, Rua José Cristino 77, CEP 20921-400, São Cristóvão, Rio de Janeiro-RJ, Brazil
2 Instituto de Física, Universidade do Estado do Rio de Janeiro, Rua São Francisco Xavier 524, Maracanã, 200550-900 Rio de Janeiro-RJ, Brazil
3 Pulkovo Observatory, Russian Academy of Sciences, 65, Pulkovo, 196140, St. Petersburg, Russia
4 Sobolev Astronomical Institute, St. Petersburg State University, Universitetski pr. 28, St. Petersburg 198504, Russia
5 Observatorio Astrónomico de Córdoba, Laprida 854, Córdoba, 5000, Argentina
e-mail: This email address is being protected from spambots. You need JavaScript enabled to view it.
; This email address is being protected from spambots. You need JavaScript enabled to view it.
; This email address is being protected from spambots. You need JavaScript enabled to view it.
; This email address is being protected from spambots. You need JavaScript enabled to view it.
; This email address is being protected from spambots. You need JavaScript enabled to view it.
; This email address is being protected from spambots. You need JavaScript enabled to view it.
; This email address is being protected from spambots. You need JavaScript enabled to view it.
;
Received: 27 February 2012
Accepted: 12 April 2012
Abstract
Context. High-velocity halo stars provide important information about the properties of the extreme Galactic halo. The study of unbound and bound Population II stars permits us to better estimate the mass of the halo.
Aims. We carried out a detailed spectroscopic and kinematic study and have significantly refined the distance and the evolutionary state of the star.
Methods. Its atmospheric parameters, chemical abundances and kinematical properties were determined using high-resolution optical spectroscopy and employing the local-thermodynamic-equilibrium model atmospheres of Kurucz and the spectral analysis code moog.
Results. We found that CD-62°1346 is a metal-poor ([Fe/H] = −1.6) evolved giant star with Teff = 5300 K and log g = 1.7. The star exhibits high carbon and s-element abundances typical of CH stars. It is also a lead star. Our kinematic analysis of its 3D space motions shows that this star has a highly eccentric (e = 0.91) retrograde orbit with an apogalactic distance of ~100 kpc, exceeding by a factor of two the distance of the Magellanic Clouds. The star travels with very high velocity relative to the Galactocentric reference frame (VGRF = 570 km s-1).
Conclusions. CD-62°1346 is an evolved giant star and not a subgiant star, as was considered earlier. Whether it is bound or unbound to the Galaxy depends on the assumed mass and on the adopted Galactic potential. We also show that the star HD 5223 is another example of a high-velocity CH star that exceeds the Galactic escape velocity. Possible origins of these two high-velocity stars are briefly discussed. CD-62°1346 and HD 5223 are the first red giant stars to join the restricted group of hypervelocity stars.
Key words: stars: abundances / stars: chemically peculiar / stars: kinematics and dynamics
Based on observations made with the 2.2 m telescope at the European Southern Observatory (La Silla, Chile).
Tables 1 and 3 are available in electronic form at http://www.aanda.org
© ESO, 2012
1. Introduction
The first work that identified stars moving with extreme velocities in the Galactic rest frame VGRF (extreme-velocity stars) was based on their measured high proper motions (see Carney & Peterson 1988 and references therein). Carney & Peterson (1988) found five stars with VGRF ≥ 380 km s-1, where  , and U0, V0 and W0 are the star Galactocentric velocity components. The highest velocity halo star of their sample moves through the solar neighborhood with a VGRF of 490 km s-1. However, none of these stars exceeds the Galaxy’s escape velocity (~536 km s-1 at the distance of the Sun, according to the Galactic potential of Allen & Santillan 1991) and are bound to the Galaxy. The first hypervelocity star (VGRF = 709 km s-1), i.e. an unbound star traveling with a VGRF velocity higher than the escape velocity, was discovered by Brown et al. (2005): SDSS J090745.0+024507, a late B-type main-sequence star at the distance of ~110 kpc in the Galactic halo. According to Hills (1988), hypervelocity stars (HVSs) are a natural consequence of the presence of a massive black hole in the Galactic center. One year later four additional HVSs were discovered, SDSS J091301.0+305120 and SDSS J091759.5+672238 (Brown et al. 2006b) and SDSS J110557.45+093439.5 and SDSS J113312.12+010824 (Brown et al. 2006a), traveling with VGRF at least + 558 ± 12, +638 ± 12, + 508 ± 12, and + 418 ± 10 km s-1, respectively. Assuming that these HVSs are B8 main-sequence stars, Brown and collaborators estimated their heliocentric distances to be 75, 55, 75, and 55 kpc, respectively.
Up to now 17 HVS have been found (Brown et al. 2009) and most of the known HVSs are early-type main-sequence stars. Only a very limited number of evolved HVSs was discovered: US 708, a low-mass hot subdwarf star of spectral type sdO (Hirsch et al. 2005) and SDSS J153935.67 + 023909.8, a Population II horizontal branch star with VGRF ~ 700 km s-1, one of the fastest halo stars known (Przybilla et al. 2010). Following the discovery of US 708, Tillich et al. (2011) searched for other hot subdwarfs and found 10 new subdwarf HVS candidates, among them SDSS J121150.27 + 143716.2 which is even faster than SDSS J153935.67+023909.8, with VGRF ~ 713 km s-1. Kinematic studies of the HVSs are based mainly on their radial velocities (RVs) alone. Proper motions can be measured only for a few HVSs (Tilich et al. 2009, 2011). Field halo stars and globular clusters have been used to estimate the mass of the halo. However, only the objects with the most extreme velocities may provide tight constraints for the mass estimates (Sakamoto et al. 2003; Smith et al. 2007). Therefore, the study of additional high-velocity stars in the halo and consideration of stars other than B/BHB stars is of the utmost importance.
In this work we report the discovery of a CH star traveling with VGRF = 577 km s-1 close to the local escape velocity vesc = 664.5 km s-1 at the star distance, determined using the Galactic gravitational potential of Ortega et al. (2002). As we will show in Sect. 4.4, CD-62°1346 belongs to the small known group of fastest moving stars in the halo, and is one of the first red giant stars to be candidate for an HVSs group. CD-62°1346 was first recognized as a metal-poor chemically peculiar star by Bond (1970) and was later spectroscopically investigated by Luck & Bond (1991) in an extensive investigation performed by these authors on CH and barium stars. CD-62°1346 was included in the Kapteyn group by Wylie-de Boer et al. (2010) based on the short star – Sun distance (300 pc) adopted by these authors. CD-62°1346 was selected as a target to be observed in the framework of our high-resolution spectroscopy survey dedicated to analyze a large sample of chemically peculiar barium stars from MacConnell et al. (1972) and some stars from Luck & Bond (1991). Of the 230 surveyed stars, we have already discovered a new CH subgiant, BD-03°3668 (Pereira & Drake 2011) and a sample of metal-rich barium stars (Pereira et al. 2011). To understand the origin of an extreme high-velocity star, it is necessary to know its detailed abundance pattern. Hence, a detailed kinematic and chemical abundance study of the star is needed. In the course of our analysis we found it interesting to compare the kinematic properties of other CH stars that are already known in the literature, with those of CD-62°1346. As we will show, we found that another CH star, HD 5223, has a VGRF of 713 km s-1, a velocity similar to that of one of the fastest known halo stars: SDSSJ153935.67+023909.8 (Przybilla et al. 2010) with VGRF = 694 km s-1.
2. Observations
The high-resolution spectrum of CD-62°1346 analyzed in this work was obtained with the FEROS (Fiberfed Extended Range Optical Spectrograph) echelle spectrograph (Kaufer et al. 1999) at the 2.2 m ESO telescope at La Silla (Chile) on the night of October 19, 2008. The FEROS spectral resolving power is R = 48 000, corresponding to 2.2 pixels of 15 μm, and the wavelength coverage goes from 3800 Å to 9 200 Å. The nominal signal-to-noise ratio (S/N) was evaluated by measuring the rms flux fluctuation in selected continuum windows, and the typical value was S/N = 100 − 150 after one exposure of 1200 s. The spectra were reduced with the MIDAS pipeline reduction package consisting of the following standard steps: CCD bias correction, flat-fielding, spectrum extraction, wavelength calibration, correction of barycentrer velocity, and spectrum rectification. Figure 1 shows the spectrum of CD-62°1346 in the 6130 − 6170 Å region. A redshift of about 2.6 Å due to the radial velocity of 126.5 km s-1 is observed.
3. Analysis and results
3.1. Line selection, equivalent width measurements and oscillator strengths
The atomic absorption lines selected in the present study are basically the same as used in previous studies devoted to the analysis of photospheric abundances of chemically peculiar stars (Pereira & Drake 2009). The selected lines are sufficiently unblended to yield reliable abundances. Table 1 shows the Fe i and Fe ii lines employed in the analysis, the lower excitation potential χ(eV) of the transitions, the log gf values, the measured equivalent widths EWλ and the derived iron abundances for each line. The log gf values for the Fe i and Fe ii lines given in Table 1 were taken from Lambert et al. (1996).
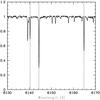 |
Fig. 1 Spectrum of CD-62°1346. Short dashed vertical lines show the transitions of Fe i 6137.70, Ba ii 6141.73 and Ca i 6162.12. The spectral lines are redshifted by about 2.6 Å due to a radial velocity of 126.5 km s-1. |
3.2. Determination of the atmospheric parameters
The determination of stellar atmospheric parameters such as effective temperature (Teff), surface gravity (log g), microturbulence (ξ), and [Fe/H] (throughout, we use the notation [X/H] = log(N(X)/N(H))⋆ − log(N(X)/N(H))⊙) are prerequisites for determining photospheric abundances. The atmospheric parameters were determined using the local thermodynamic equilibrium (hereafter LTE) model atmospheres of Kurucz (1993) and the spectral analysis code MOOG (Sneden 1973).
The solution of the excitation equilibrium used to derive the effective temperature (Teff) was defined by a zero slope of the trend between the iron abundances derived from Fe i lines and the excitation potential of the measured lines. The microturbulent velocity (ξ) was found by constraining the abundance, determined from individual Fe i lines, to show no dependence on Wλ/λ. The solution thus found is unique, depending only on the set of Fe i,ii lines and the atmospheric model employed. As a by-product this yields the metallicity [Fe/H] of the star. The value of log g in Table 2 was determined by means of the ionization balance assuming LTE. The final adopted atmospheric parameters are given in Table 2. Typical uncertainties of σ(Teff) = 120 K, σ(log g) = 0.2 dex, and σ(ξ) = 0.3 km s-1 were found. Table 2 also provides previous atmospheric parameter determinations derived in other studies.
Atmospheric parameters of CD-62°1346.
3.3. Abundance analysis
The abundances of chemical elements were determined with the LTE model atmosphere techniques. In brief, equivalent widths are calculated by integrating through a model atmosphere and are then compared with the observed equivalent widths. The calculations are repeated, changing the abundance of the element in question, until a match is achieved. The current version of the line-synthesis code moog (Sneden 1973) was used to carry out the calculations. Table 3 shows the atomic lines used to derive the abundances of the elements. Atomic parameters for several transitions of Ti, Cr, and Ni were retrieved from the library of the National Institute of Science and Technology Atomic Spectra Database (Martin 2002). The derived abundances and the C/O ratio are given in Table 4.
The barium abundance was derived using the Ba ii lines at λ 4554.0, λ 4934.1, λ 5853,7, and λ 6141.7 Å. The line data that include hyperfine splitting were taken from McWilliam (1998).
The lead abundance was derived from the Pb i line at λ4057.81 Å. The line data, which include isotopic shifts and hyperfine splitting, were taken from Van Eck et al. (2003).
Carbon, nitrogen, and oxygen abundances were also determined using the spectrum synthesis technique. Since the abundances of the CNO elements are interdependent because of the association of carbon and oxygen in CO molecules in the atmospheres of cool giants, the CNO abundance determination procedure was iterated until all abundances of these three elements agreed. The abundances of carbon and nitrogen were determined using the lines of the CH, CN, and C2 molecules. The line lists were assembled by ourselves and are the same as in Drake & Pereira (2008) and Pereira & Drake (2009), who studied the chemically peculiar metal-poor stars HD 104340, HD 206983, HD 10613, and BD+04°2466. Nevertheless, studying the Fehrenbach & Duflot star (hereafter Feh-Duf), we have updated the value of the dissociation potential of the CN molecule (Drake & Pereira 2011). In the above mentioned papers, we used the value D0(CN) = 7.65 eV determined by Engleman & Rouse (1975). More recent studies based on experimental determinations (Huang et al. 1992; Costes et al. 1990) as well as on theoretical calculations (Pradhan et al. 1994) showed that the dissociation energy of the CN molecule is higher, about 7.75 eV, and this value was used in the synthetic spectra calculations. However, we have to mention that the uncertainty in the derived nitrogen abundance is high because of the strong contamination by telluric H2O lines and the low S/N ratio in this spectral region. The oxygen abundance was inferred from the [O i] forbidden line at λ6300.304 Å. In our calculations for this line we used the oscillator strength log gf = −9.717 obtained by Allende Prieto et al. (2001) in their analysis of the solar oxygen abundance.
Chemical abundances derived for CD-62°1346 in the scale log ε(H) = 12.0 and in the notations [X/H] and [X/Fe].
3.4. Abundance uncertainties
The uncertainties of the derived abundances for the program stars are dominated by two main sources: the errors in the stellar parameters and errors in the equivalent width measurements.
The abundance uncertainties owing to errors in the stellar atmospheric parameters Teff, log g, and ξ were estimated by varying these parameters by their standard errors and then computing the changes incurred in the element abundances. The results of these calculations are displayed in Cols. 2 to 5 of Table 5.
The abundance uncertainties owing to errors in the equivalent widths measurements were computed from an expression provided by Cayrel (1988). The errors in the equivalent widths are essentially set by the signal-to-noise ratio and by the resolution of the spectra. In our case, having R ≈ 50 000 and a typical S/N ratio of 150, the expected uncertainties in the equivalent widths are about 2 − 3 mÅ.
Under the assumption that the errors are independent, they can be combined quadratically so that the total uncertainty is
 These final uncertainties are given in the sixth column of Table 5. The last column gives the observed abundance dispersion among the lines for those elements with more than three available lines. Table 5 also shows that neutral elements are fairly sensitive to temperature variations, while single ionized elements are sensitive to the variations in log g. The uncertainties in microturbulence also contribute to the compounded errors, especially for strong lines such as the barium lines. For the elements analyzed via spectrum synthesis, the same technique was used, by varying Teff, log g, and ξ and then computing the abundance changes introduced by the variation in these atmospheric parameters. The resulting uncertainties are also included in Table 5.
Abundance uncertainties for CD-62°1346.
4. Discussion
4.1. Abundances
Below we discuss the abundance pattern of CD-62°1346 by comparing it with previous studies for some halo population stars and also with the abundance pattern of chemically peculiar stars with heavy-element overabundances already reported in the literature. Figure 2 shows the abundance pattern of CD-62°1346 analyzed in this work.
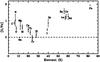 |
Fig. 2 Abundance pattern of CD-62°1346. Error bars represent the uncertainty estimates described in the text. |
4.1.1. Nitrogen and oxygen
Abundance surveys of dwarf stars show that there is no trend in the [N/Fe] versus [Fe/H] ratio, that is, in the metallicity range −2.0 < [Fe/H] < +0.3, [N/Fe] is ≈ 0.0 (Clegg et al. 1981; Tomkin & Lambert 1984; Carbon et al. 1987). In giant stars, the nuclear processed material, caused by the deepening of its convective envelope, is brought from the interior to the outer layers of the star, which changes the surface composition. As a consequence of the first dredge-up process, the abundance of 12C is reduced and the abundance of nitrogen is enhanced (Lambert 1981). The nitrogen-to-iron ratio in CD-62°1346 is high, [N/Fe] = 1.0, similar of that of the mean [N/Fe] ratio observed in the CH stars analyzed by Vanture (1992b) ([N/Fe] =1.3 ± 0.6) and also to that in the CH star BD+04°2466 analyzed by Pereira & Drake (2009) with [N/Fe] = 1.1 ± 0.3. However, this value has to be considered with caution because the spectral region around ~8000 Å, used for the nitrogen determination, is contaminated by telluric H2O lines and has a relatively low S/N ratio.
Comparison of the oxygen-to-iron ratio for CD-62°1346 with Galactic halo stars indicates that the [O/Fe] is comparable to that of stars with similar metallicity in the Galaxy (Nissen et al. 2002) (see Fig. 3).
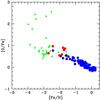 |
Fig. 3 [O/Fe] versus [Fe/H] for CD-62°1346 (black circle), disk stars (blue circles), CEMP-s stars (red circles), and CEMP-no stars (green triangles). Abundance data for the disk stars are taken from Edvardsson et al. (1993) and Nissen et al. (2002). Abundance data for CEMP-no stars are taken from Cayrel et al. (2004) and from Masseron et al. (2010) and abundance data for CEMP-s stars are taken from Masseron et al. (2010). |
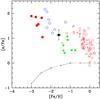 |
Fig. 4 Diagram of [s/Fe] versus [Fe/H] for several classes of chemically peculiar binary stars. Barium giants (red open squares); CH stars (blue open polygons); subgiant CH stars (red plus signs); yellow-symbiotics (green filled diamonds); CEMP stars that are members of binary systems (red filled circles). The position of CD-62°1346 is marked by a black filled circle. Abundance data for barium giant and dwarf stars are taken from Allen & Barbuy (2006), Antipova et al. (2004), Liang et al. (2003), North et al. (1994), Smith et al. (1993), Drake & Pereira (2008), Pereira (2005), Pereira & Drake (2009, 2011); CH stars are taken from Vanture (1992b) and Van Eck et al. (2003); yellow symbiotics are taken from Smith et al. (1996, 1997) and Pereira & Roig (2009). The solid line is the mean ⟨ [s/Fe] ⟩ for field stars (Gratton & Sneden 1994; Ryan et al. 1996; François et al. 2003). |
4.1.2. Sodium to nickel
In metal-poor stars the sodium abundance was investigated by Gratton & Sneden (1987), McWilliam et al. (1995), Fulbright (2002), and François et al. (2003). Between [Fe/H] = −1.0 and −3.0, the [Na/Fe] ratio is roughly constant and begins to decline at [Fe/H] = −3.0 (Cayrel et al. 2004). Our value of −0.01 for the [Na/Fe] ratio at [Fe/H] = −1.59 seems to follow the trend observed in the metal-poor stars, especially for the metallicity range between −2.0 < [Fe/H] < − 1.0 (Fulbright 2002).
The mean α-element abundance is [((Mg+Si+Ca+ Ti)/4)Fe] = 0.52 ± 0.18, which is similar for stars at this metallicity (Carretta et al. 2002). The chromium and nickel abundances are expected to follow iron and do indeed with [Cr/Fe] and [Ni/Fe] = −0.04 and − 0.13, respectively. The [Ni/Fe] ratio remains close to 0.0 in a metallicity range from −2.0 to 0.0 (Jonsell et al. 2005). The chromium-to-iron ratio also displays no trend at all for metal-poor stars. CD-62°1346 has a typical [Cr/Fe] ratio of a metal-poor star at [Fe/H] ~ −1.6.
4.1.3. Carbon and s-process elements
Figure 4 shows the [s/Fe] ratio for CD-62°1346 analyzed in this work, where ’s’ represents the mean of the elements created by slow neutron capture reactions (s-process): Y, Zr, Ba, La, Ce, and Nd. This figure also shows the [s/Fe] ratios for the barium stars (giants and dwarfs), the yellow symbiotic stars, the CH stars and the carbon-enhanced metal-poor (CEMP) stars. We also show the position of six CEMP stars that are binaries: CS 22942-019, CS 22948-027, CS 29497-030, CS 29497-034, CS 22964-161, and HE 0024-2523, the data of which concerning their carbon and heavy-element (Z > 56) overabundances and binarity, were taken from recent results: Preston & Sneden (2001), Sivarani et al. (2004), Barbuy et al. (2005), Lucatello et al. (2003), Thompson et al. (2008), Aoki et al. (2002), and Hill et al. (2000). As we can see from this figure, CD-62°1346 is heavily enhanced in the s-process elements, similar to other CH stars.
Figure 5 shows the [C/Fe] abundance ratio plotted as a function of the metallicity, given by [Fe/H], for the same objects as in Fig. 4. This figure shows carbon overabundance for chemically peculiar objects that are members of binary systems. We note that CD-62°1346 has a “normal” [C/Fe] ratio for a chemically peculiar binary star at this metallicity.
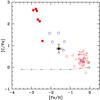 |
Fig. 5 Diagram of [C/Fe] versus [Fe/H] for several classes of chemically peculiar binary stars. Symbols have the meaning as in Fig. 4. The solid line is the mean ⟨ [C/Fe] ⟩ for field stars, taken from Masseron et al. (2006). |
The lead abundance was determined using a spectral synthesis technique. Figure 6 shows the observed and the synthetic spectra of CD-62°1346 around Pb i λ4058 Å. In Fig. 7, we show the [Pb/Ce] ratio as a function of metallicity [Fe/H]. In this figure, we show CD-62°1346 (the filled black circle at [Fe/H] = −1.59), the CH stars analyzed by Van Eck et al. (2003), CEMP stars that are members of binary systems, and the barium giants and dwarfs from Allen & Barbuy (2006). The solid line represents the prediction from the standard partial mixing (PM) model as given by Goriely & Mowlavi (2000). The position of CD-62°1346 in this diagram follows the same trend as other barium dwarfs and giants investigated so far. For the [Pb/Ce] ratio the proton-mixing scenario confirms the trend seen in several CH stars with high lead abundances (Van Eck et al. 2003; Goriely & Mowlavi 2000).
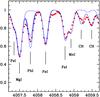 |
Fig. 6 Observed (dots) and synthetic (lines) spectra of CD-62°1346 in the region around the Pb i line at λ4057.8 Å. The synthetic spectra are shown for lead abundances of log ε(Pb) = 2.21, 2.41, and 2.61. The upper line shows a synthesis without contribution from the Pb i and CH lines. |
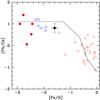 |
Fig. 7 Behavior of the [Pb/Ce] ratio with metallicity. Symbols have the same meaning as in Fig. 4. The solid line represents the prediction from the standard partial mixing (PM) model as given by Goriely & Mowlavi (2000). We considered only those CEMP-s stars that have already been proven to be binary systems. |
To summarize this section, we find that CD-62°1346 has a similar abundance pattern compared to other CH stars, that is, C/O > 1.0, low metallicity, s-process enrichment (it is also a “lead star”) and a [α/Fe] ratio similar to halo stars. As do a majority of CH stars, CD-62°1346 has a high radial velocity.
Although the abundance pattern of CH stars has been well investigated in the last years and they were also found to be lead stars (Van Eck et al. 2003), their kinematical properties were poorly investigated in the literature. In the next sections we will explore the results obtained from the kinematical analysis with the help of the spectroscopic distance and radial velocity of CD-62°1346 and compare its space velocity components with other CH and also some metal-poor barium stars.
4.2. Distance and luminosity of CD-62°1346
The relation between the distance to the Sun r, temperature, gravity, mass, V magnitude, and the interstellar absorption (AV) is given by 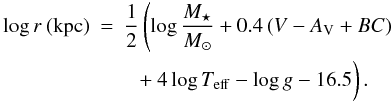 (1)For the derived temperature and the visual magnitude, V = 9.851, Eq. (1) can be written as
 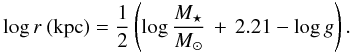 (2)In these calculations we used Mbol ⊙ = + 4.74 (Bessel 1998) and BC = −0.19 (Alonso et al. 1999). The interstellar absorption was estimated from the relation between the equivalent width of the Na D2 interstellar line and the color excess E(B − V) given in Munari & Zwitter (1997). For the equivalent width of 67 mÅ we found a color excess of 0.04. Finally, for the value of log g = 1.7, and adopting the mass M∗ = (0.8 ± 0.2) M⊙, the most likely value for the mass of CH stars (McClure & Woodsworth 1990), we obtain a distance r = 1.6 ± 0.5 kpc.
The estimation of the distance of CD-62°1346 deserves discussion. A Hipparcos parallax was measured for this star: π = 5.47 ± 1.72 (van Leeuwen 2007) corresponding to the distance d = 183 + 83-44 pc. However, this parallax and the visual magnitude V = 9.85 correspond to MV = 3.4 + 0.6-0.8 placing CD-62°1346 at the beginning of the subgiant branch where the star has to have high log g value, incompatible with what we obtained in our spectroscopic study. A similar disagreement between the Hipparcos parallax and the evolutionary state of a star appeared also in the analysis of the metal-poor halo star BD+17°3248 performed by Cowan et al. (2002) forcing the authors to disregard the Hipparcos parallax for this star. For the same reason we also disregard the Hipparcos parallax for CD-62°1346.
CD-62°1346 was classified for the first time as a CH subgiant star by Bond (1974). In his paper, introducing a new class of peculiar stars – the CH subgiant stars –, luminosity estimations were based on the reduced proper motions, which for CD-62°1346 would result in underestimating its luminosity. Later the photometric estimation of the absolute magnitude of CD-62°1346 was carried out by Norris et al. (1985) based on the BVRI and DDO photometry, which resulted in a distance of 470 pc. However, the C(3842) and C(4245) indexes of the DDO system are sensitive to the intensities of CN and CH molecular bands, because they include the violet CN band and CH G-band, respectively. As we have shown in Sect. 3.3, CD-62°1346 is a CH star enriched in carbon ([C/Fe] = +0.86). This may explain the discrepancy in the luminosity found by photometric analysis and by our spectroscopic determination.
Luck & Bond (1991) used for the analysis of CD-62°1346 photographic image-tube spectrogram with the dispersion 4.6 Å/mm. A relatively low spectral resolution (~0.2 Å) may explain the higher metallicity ([Fe/H] = −0.97) derived by these authors. The higher value of metallicity derived by means of neutral iron lines might, in turn, result in the high value of log g derived by forcing the Fe ii lines to yield the same iron abundance. A more recent analyses based on high-resolution spectra gave a lower surface gravity and lower metallicity (Ryan & Lambert 1995; Wylie-de Boer et al. 2010) (see Table 2).
Beers et al. (2000), using the analytical relation between MV and (B − V)0, estimated a distance of 300 pc, a value that was later adopted by Wylie-de Boer et al. (2010). At this distance, CD-62°1346 would have log g = 3.2. However, performing spectroscopic analysis of this star, Wylie-de Boer et al. (2010) found a value of log g = 1.92, which is similar to our result.
Based on the distance and the interstellar absorption determined above, we estimated the bolometric magnitude and luminosity as Mbol = −1.5 ± 0.7 and log L/L⊙ = 2.5 ± 0.2. Since CD-62°1346 displays properties of a halo star (high radial velocity and high Galactic latitude, b = −39.5°), and is also s-process enriched (Sect. 4.1.3), it is a CH star and hence a binary star. Indeed, according to Table IV of Hartwick & Cowley (1985), CH stars have MV values between − 0.25 and − 2.2. CD-62°1346 with MV = −1.3 will be then another CH star, as we have already concluded in Sect. 4.1.
4.3. Radial velocity and proper motions
Tables 6 and 7 show all measurements of the radial velocity and proper motions of CD-62°1346 available in the literature. The proper motions of CD-62°1346 seem to be well determined, since all measurements give consistent values.
The small variations of the observed radial velocity values seen in Table 6 may be the result of the orbit orientation and the distance between the components of the binary system. The first radial velocity measurement was made by Hesser & Harris (1979) and yielded 119 km s-1. Later measurements made by Norris et al. (1985), Schuster et al. (2006) and recently by RAVE (Siebert et al. 2011) gave consistent RV values.
References for radial velocity for CD-62°1346.
References for proper motions for CD-62°1346.
4.4. Kinematics
At a distance of 1.6 kpc from the Sun and a mass of 0.8 M⊙, for CD-62°1346, we calculated the heliocentric space velocity components U0 = −39.8 km s-1, V0 = −773.9 km s-1 and W0 = 171.2 km s-1, where U is positive toward the Galactic center (l = 0°,b = 0°), V is positive in the direction of Galactic rotation (l = 90°,b = 0°) and W is positive toward the north Galactic pole (b = 90°). The algorithm of Johnson & Soderblom (1987) was employed in the calculation using Hipparcos proper motions μα cos δ = −14.97 and μδ = − 102.19 (Perryman 1997) and the radial velocity derived in this study (Table 6). The transformation from the heliocentric to the Galactocentric reference frame system (GRF) was performed using the peculiar solar motion of Coşkunoğlu et al. (2011), the Galactocentric solar distance of 8.5 kpc and Local Standard of Rest (LSR) rotation velocity relative to the GRF of 220 km s-1. The modulus of the star velocity in this reference system VGRF can then be computed, giving 569.8 km s-1. The high heliocentric azimuthal velocity component V0 already suggests that CD-62°1346 may be unbound. To check this, we compared the calculated VGRF with the escape velocity at the star distance. Using the Galactic gravitational potential described in Ortega et al. (2002), we found vesc = 664.5 km s-1 for the escape velocity. So CD-62°1346 would be a bound object. We note, however, that the distances from formula (2) depend on the adopted mass of the star. It is then interesting to see whether the condition for the star to be bound can change with the distances. In Table 8 we show the results for several adopted masses and distances. For the mass of 1 M⊙ and a distance of 1.8 kpc, which are within the uncertainties, CD-62°1346 is already becoming unbound. What if other potentials of the Galaxy were used? We note that CD-62°1346 would be unbound in the potential of Allen & Santillan (1991) already at the adopted distance of 1.6 kpc. If we used the potential of Johnston et al. (1996), which gives for the escape velocity vesc = 539 km s-1 at distances 1.6 up to 2 kpc, CD-62°1346 would be an unbound object. In Sect. 4.4.2 we show the orbit of this star calculated with the Ortega et al. (2002) potential; it probes the Galactic halo up to 100 kpc. At this distance the halo-enclosed mass is 6.43 × 10¹¹ M⊙, the potential by Allen & Santillan (1991) gives 8 × 10¹¹ M⊙, while the potential by Johnston et al. (1996) gives 3.8 × 10¹¹ M⊙.
4.4.1. The V − U and e − Jz diagrams
To provide a deeper study of the kinematic properties of CD-62°1346, we analyzed its position in the V − U and e − Jz diagrams, where e is the eccentricity and Jz the Z-component of the angular momentum, and also examined its orbit in space. In addition, as mentioned before, we also investigated the kinematic behavior of other metal-poor barium and CH stars.
Among the barium stars we selected three stars, HD 10613, HD 123396 and HD 206983, which have already been investigated in the literature and are also known to be metal-poor objects, s-process enriched and have C/O ratios less than unity. Among the CH stars, we selected the early-type CH stars and Feh-Duf. We computed the distances for all metal-poor barium stars and CH stars as in Eq. (1), taking into consideration the temperature and gravity already determined. Bolometric corrections were also determined from Alonso et al. (1999). Interstellar absorption was considered using the results from the literature, and is not higher than AV = 0.3. Proper motions were also taken from Hipparcos (Perryman 1997). We adopted M∗ = 0.8 M⊙. Table 9 shows the temperature and gravity used to determine the distance, the radial velocities, the Galactocentric space velocity components for the stars mentioned above, and values of the velocity VGRF. The last column of Table 9 gives the reference for the temperature, gravity, and radial velocity for the studied stars.
Inspecting Table 9 we may conclude that among the metal-poor barium stars, HD 206983 has the highest value of the V0, similar to the CH stars HD 26 and HD 209621. The high negative values, and those of some other CH stars, can be taken as an indication that they lag in the Galactic rotation compared to the solar motion.
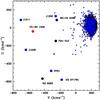 |
Fig. 8 V − U diagram for CD-62°1346 (red filled circle) and other CH stars, BD+04°2466, HD 5223 and Feh-Duf (black filled circles). We also show the positions of five hypervelocity stars (blue filled circles). The stars from Holmberg et al. (2009) serve as reference. Black “x” points represent stars with distances from the Galactic plane less than 1 kpc, while blue “x” points represent those above 1 kpc from the Galactic plane. |
However, the most interesting results arise from the space velocities and VGRF of the stars, BD+04°2466, HD 26 and HD 5223. Excluding Feh-Duf, whose kinematical behavior has already been investigated (Drake & Pereira 2011), these three objects present the highest VGRF among the CH stars. The VGRF values of HD 5223 (713 km s-1) and of CD-62°1346 (569 km s-1) are similar to, or even higher, than some hypervelocity stars already investigated in the literature, such as SDSS J130005.62 + 042201.6 (467 km s-1, Tillich et al. 2010); HD 271917 (615 km s-1, Heber et al. 2008); HIP 60350 (535 km s-1, Irrgang et al. 2010); and SDSS J013655.91 + 242546.0 (594 km s-1, Tillich et al. 2009). Figure 8 shows the position of CD-62°1346, BD+04°2466, HD 5223 and Feh-Duf and some hypervelocity stars in the V − U diagram. The kinematical data from the work of Holmberg et al. (2009) was used as a reference. In this work the authors determined the space velocities and orbital parameters over 13 000 nearby F and G dwarf stars. CD-62°1346 and HD 5223 and hypervelocity stars lie very far away from the Galactic disk population. Therefore, CD-62°1346 is a hypervelocity candidate because the value of VGRF is constrained by its mass, and hence its distance, while HD 5223 is a hypervelocity star, not recognized before as such in the literature. Its escape velocity according to the Galactic potential of Ortega et al. (2002) is 658 km s-1. These two stars are the first cool, chemically peculiar stars to join the restricted group of hypervelocity B stars first identified by Brown et al. (2005).
Mass, distance, total Galactic reference frame velocity (VGRF) and the escape velocity vesc calculated for the different stellar masses.
Atmospheric parameters (effective temperature and surface gravity), distance, radial velocity (RV), space velocity components relative to the Sun (U0, V0, W0), and the Galactic rest frame velocity (VGRF) for some metal-poor barium and CH stars.
Figure 9 shows the position of CD-62°1346, SDSS J130005.62 + 042201.6 (Tillich et al. 2010) and SDSS 121150.27 + 143762.2 (Tillich et al. 2011) and the F and G dwarf stars from Holmberg et al. (2009) in the e − Jz diagram. We do not show the position of HD 5223 in this diagram since it has a VGRF higher than the escape velocity of the Galaxy. Again, we see that CD-62°1346 lies very far away from the Galactic disk population.
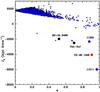 |
Fig. 9 CD-62°1346, BD+04°2466, Feh-Duf, SDSS J130005.62 + 042201.6 and SDSS 121150.27 + 14376.2 in the e − Jz diagram. Other symbols have the same meaning as in Fig. 8. |
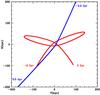 |
Fig. 10 Trajectory of CD-62°1346 (red) and HD 5223 (blue) in the XY plane. For CD-62°1346 we show the whole trajectory from −2 Gyr to 2 Gyr in time, while for HD 5223 we show only a part of it from −0.5 Gyr to 0.5 Gyr. The whole trajectory calculated from −2 Gyr to 2 Gyr extends from (X,Y) = (600,260) to (X,Y) = (−470, −430). |
4.4.2. The dynamical orbit of BD+04°2466, CD-62°1346, HD 5223 and Feh-Duf in the Galaxy
We also studied the dynamical time evolution of BD+04°2466, CD-62°1346, HD 5223 and Feh-Duf in the Galaxy. For this purpose we computed their orbits integrating back in time beginning with the present distance or initial XYZ positions relative to the Sun and with current spatial velocities (UVW). Figures 10 and 11 show the past and future orbits of CD-62°1346 and HD 5223 for the adopted present distances of 1.6 kpc and 1.2 kpc, respectively, and for the time interval from −2.0 to +2.0 Gyr. Figures 12 and 13 show the past and future orbits of Feh-Duf and BD+04°2466 for the adopted present distance of 6.0 kpc and 1.7 kpc, respectively, and for the time interval from −2.0 Gyr to the present date. These figures show the time evolution of the distances relative to the Galactic center, which permits us to estimate the eccentricities of the orbits of BD+04°2466, CD-62°1346 and Feh-Duf. The stars BD+04°2466 and Feh-Duf have orbits typical of halo stars, extending ± 10.0–20.0 kpc out of the plane of the Galactic disk.
CD-62°1346 has a highly eccentric orbit (e = 0.9, Fig. 9) and is almost unbound to the Galaxy, traveling up to 50 kpc from the plane of the Galactic disk and about 100 kpc from the Galactic center. HD 5223, in turn, has an orbit that goes much farther of the Galactic disk, X = 600 kpc (out of the range of Fig. 10), and its value from the Galactic plane ranges from −30 to 110 kpc for the same time interval from −2 Gyr to +2 Gyr. It is interesting that CD-62°1346 and HD 5223 have basically the same abundance pattern (low metallicity, carbon and s-process enrichment) but are kinematically and dynamically different from the other CH stars. Because globular clusters are also known to have some CH stars among its members, we cannot exclude the possibility that HD 5223 could have been ejected from one of these systems. Alternatively, HD 5223 could have an extragalactic origin and was captured by the Milky Way after a tidal disruption of a nearby satellite galaxy and will not belong to the Galaxy since its VGRF exceeds the Galaxy escape velocity. CD-62°1346, like Feh-Duf (Drake & Pereira 2011), might has been captured by the Milky Way and became a halo star (since it has a highly eccentric and retrograde orbit) or, depending on the assumed mass and hence its distance, it could be an unbound star.
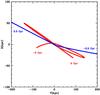 |
Fig. 11 Same as in Fig. 10 but in the YZ plane. For HD 5223 the whole trajectory extends from (Z,Y) = ( − 30,260) to (Z,Y) = (110, − 400). |
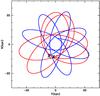 |
Fig. 12 Trajectory of BD+04°2466 (red) and Feh-Duf (blue) in the XY plane. We show the orbits from −2 Gyr to the present position labeled with “X”. We also show the position of the Sun. |
5. Conclusions
The results from our abundance and kinematical analysis performed by employing high-resolution optical spectra of the CH star CD-62°1346 can be summarized as follows :
-
1.
CD-62°1346 is a CH star and also a “lead star” because its lead-to-cerium ratio is high ([Pb/Ce] = +0.80) and closely follows the theoretical predictions for a star of this metallicity. It is an evolved metal-deficient giant with Teff = 5300 K and log g = 1.7. We found also that this star has the high carbon ([C/Fe]) and s-element abundance typical for CH stars.
-
2.
CD-62°1346 has to be excluded from the Kapteyn group (Wylie-de Boer et al. 2010) since the distance adopted by these authors is too small. In addition, the position in the e − Jz diagram shows that CD-62°1346 has an extreme retrograde motion, high eccentricity, and very negative angular momentum. The position of CD-62°1346 in J⊥ − Jz diagram of Kepley et al. (2007) (1446, −4072) clearly indicates that it belongs to the halo population.
-
3.
Detailed kinematic analysis showed that CD-62°1346 has a VGRF close to the Galaxy escape velocity, making it marginally bound. This is constrained by the adopted mass and hence the distance. The extreme retrograde motion may suggest that the CD-62°1346 has an extragalactic origin and was captured by the Milky Way. However, the high α-element abundances, typical for halo stars of this metallicity, do not support this suggestion. Nissen & Schuster (2010) showed that dwarf stars could be distinguished according to their [α/Fe] ratios. Those with high [α/Fe] ratios would belong to the halo population and those with low [α/Fe] ratios may have been captured from nearby galaxies. Feh-Duf, like other extreme retrograde stars with low α-element abundances, would be another example (Venn et al. 2003; Drake & Pereira 2011).
-
4.
Among the CH stars, we found that HD 5223 is not bound to the Galaxy because its VGRF exceeds the Galaxy escape velocity. It is unbound for any Galactic potential considered in this work. Tidal disruption of a satellite galaxy or ejection from a globular cluster are good suggestions to explain its dynamical orbit through the Galaxy.
-
5.
Among other objects that display the same abundance pattern, s-process enrichment, halo membership, and binarity, the yellow symbiotics (Pereira & Roig 2009) were also kinematically investigated to check whether they would behave like some of these CH stars. Although their distances are more difficult to constrain due to, in some cases, uncertainties in the interstellar absorption, none of them displays high VGRF or has retrograde motion. CEMP-s stars are another group that would deserve investigation because they display the same phenomena, mass-transfer with s-process enrichment in a binary system. Indeed, this has already been done by Carollo et al. (2012). Although they found many stars with significant retrograde evidence (Vφ < −200 km s-1), none of them seems to have VGRF higher than the Galaxy escape velocity.
-
6.
Hypervelocity stars are good candidates to constrain the Galactic potential (Kenyon et al. 2008). CD-62°1346 is another example of a star that may be bound or unbound according to the Galactic potential adopted. CD-62°1346 and HD 5223 are the first red giants to join the restricted group of hypervelocity stars which formerly consisted of B-type stars only.
Online material
Observed Fe i and Fe ii lines.
Other lines studied.
continued.
Acknowledgments
N.A.D. acknowledges support of the Saint Petersburg State University, Russia, under the Project 6.38.73.2011. N.A.D. also acknowledges the support of PCI/MCTI grant under the Project 311.868/2011-8 (Brazil). We also acknowledge the use of electronic databases (VALD, SIMBAD, NASA’s ADS).
References
- Allen, C., & Santillan, A. 1991, Rev. Mex. Astron., & Astrof., 22, 255 [Google Scholar]
- Allen, D. M., & Barbuy, B. 2006, A&A, 454, 895 [NASA ADS] [CrossRef] [EDP Sciences] [Google Scholar]
- Allen de Prieto, C., Lambert, D. L., & Asplund, M. 2001, ApJ, 556, L63 [NASA ADS] [CrossRef] [Google Scholar]
- Alonso, A., Arribas, S., & Martínez-Roger, C. 1999, A&A, 140, 261 [Google Scholar]
- Aoki, W., Ryan, S. G., Norris, J. E., et al. 2002, ApJ, 580, 1149 [NASA ADS] [CrossRef] [Google Scholar]
- Antipova, L. I., Boyarchuk, A. A., Pakhomov, Yu. V., & Panchuk, V. E. 2004, Astron. Rep., 48, 597 [NASA ADS] [CrossRef] [Google Scholar]
- Barbier-Brossat, M., Petit, M., & Figon, P. 1984, A&AS, 108, 603 [Google Scholar]
- Barbuy, B., Spite, M., Spite, F., et al. 2005, A&A, 429, 1031 [NASA ADS] [CrossRef] [EDP Sciences] [Google Scholar]
- Bastian, U., & Röser, S. 1993, Positions and Proper Motions – South, Astronomisches Rechen-Institut, Heidelberg [Google Scholar]
- Beers, T. C., Chiba, M., Yoshii, Y., et al. 2000, AJ, 119, 2866 [NASA ADS] [CrossRef] [Google Scholar]
- Bessell, M. S., Castelli, F., & Plez, B. 1998, A&A, 333, 231 [NASA ADS] [Google Scholar]
- Bond, H. E. 1970, ApJS, 22, 117 [NASA ADS] [CrossRef] [Google Scholar]
- Bond, H. E. 1974, ApJ, 194, 95 [NASA ADS] [CrossRef] [EDP Sciences] [Google Scholar]
- Brown, W. R., Geller, M. J., Kenyon, S. J., & Kurtz, M. J. 2005, ApJ, 622, L33 [NASA ADS] [CrossRef] [Google Scholar]
- Brown, W. R., Geller, M. J., Kenyon, S. J., & Kurtz, M. J. 2006a, ApJ, 640, L35 [NASA ADS] [CrossRef] [Google Scholar]
- Brown, W. R., Geller, M. J., Kenyon, S. J., & Kurtz, M. J. 2006b, ApJ, 647, 303 [NASA ADS] [CrossRef] [Google Scholar]
- Brown, W. R., Geller, M. J., & Kenyon, S. J. 2009, ApJ, 690, 1639 [NASA ADS] [CrossRef] [Google Scholar]
- Bystrov, N. F., Polojentsev, D. D., Potter, H. I., et al. 1994, Bull. Inf. CDS, 44, 3 [NASA ADS] [Google Scholar]
- Carbon, D. F., Barbuy, B., Kraft, R. P., et al. 1987, PASP, 99, 335 [NASA ADS] [CrossRef] [Google Scholar]
- Carney, B. W., & Peterson, R. C. 1988, AJ, 96, 378 [NASA ADS] [CrossRef] [Google Scholar]
- Carollo, D., Beers, T. C., Bovy, J., et al. 2012, ApJ, 744, 195 [NASA ADS] [CrossRef] [Google Scholar]
- Carretta, E., Gratton, R., Cohen, J. G., Beers, T. C., & Christlieb, N. 2002, AJ, 124, 481 [NASA ADS] [CrossRef] [Google Scholar]
- Carretta, E., Bragaglia, A., & Gratton, R. G. 2007, A&A, 473, 129 [NASA ADS] [CrossRef] [EDP Sciences] [Google Scholar]
- Cayrel, R. 1988, Data Analysis, in The Impact of Very High S/N Spectroscopy on Stellar Physics, ed. G. Cayrel de Strobel, & M. Spite (Dordrecht: Kluwer), 345 [Google Scholar]
- Cayrel, R., Depagne, E., Spite, M., et al. 2004, A&A, 416, 1117 [NASA ADS] [CrossRef] [EDP Sciences] [Google Scholar]
- Clegg, R. E. S., Tomkin, J., & Lambert, D. L. 1981, ApJ, 250, 262 [NASA ADS] [CrossRef] [Google Scholar]
- Corbin, T. E., Urban, S. E., & Warren, W. H., Jr. 1991, Astrographic Catalog Reference Stars [Google Scholar]
- Coşkunoğlu, B., Ak, S., Bilir, S., et al. 2011, MNRAS, 412, 1237 [NASA ADS] [Google Scholar]
- Costes, M., Naulin, C., & Dorthe, G. 1990, A&A, 232, 270 [NASA ADS] [Google Scholar]
- Cowan, J. J., Sneden, C., Burles, S., et al. 2002, ApJ, 572, 861 [NASA ADS] [CrossRef] [Google Scholar]
- Depagne, E., Hill, V., Spite, M., et al. 2002, A&A, 390, 187 [NASA ADS] [CrossRef] [EDP Sciences] [Google Scholar]
- Drake, N. A., & Pereira, C. B. 2008, AJ, 135, 1070 [NASA ADS] [CrossRef] [Google Scholar]
- Drake, N. A., & Pereira, C. B. 2011, A&A, 531, 133 [Google Scholar]
- Drake, J. J., & Smith, G. 1991, MNRAS, 250, 89 [NASA ADS] [Google Scholar]
- Edvardsson, B., Andersen, J., Gustafsson, B., et al. 1993, A&A, 275, 101 [NASA ADS] [Google Scholar]
- Engleman, R. Jr., & Rouse, P. E. 1975, J. Quant. Spectrosc. Rad. Transf., 15, 831 [Google Scholar]
- François, P., Depagne, E., Hill, V., et al. 2003, A&A, 403, 1105 [NASA ADS] [CrossRef] [EDP Sciences] [Google Scholar]
- Fulbright, J. P. 2002, AJ, 123, 404 [NASA ADS] [CrossRef] [Google Scholar]
- Girard, T. M., van Altena, W. F., Zacharias, N., et al. 2011, AJ, 142, 15 [NASA ADS] [CrossRef] [Google Scholar]
- Gratton, R. G., & Sneden, C. 1987, A&A, 178, 179 [NASA ADS] [Google Scholar]
- Gratton, R. G., & Sneden, C. 1988, A&A, 204, 193 [NASA ADS] [Google Scholar]
- Gratton, R. G., & Sneden, C. 1994, A&A, 287, 927 [NASA ADS] [Google Scholar]
- Grevesse, N., & Sauval, A. J. 1998, Space Sci. Rev., 85, 161 [NASA ADS] [CrossRef] [Google Scholar]
- Goriely, S., & Mowlavi, N. 2000, A&A, 362, 599 [NASA ADS] [Google Scholar]
- Goswami, A., & Aoki, W. 2010, MNRAS, 404, 253 [NASA ADS] [Google Scholar]
- Goswami, A., Aoki, W., Beers, T. C., et al. 2006, MNRAS, 372, 343 [NASA ADS] [CrossRef] [Google Scholar]
- Hartwick, F. D. A., & Cowley, A. P. 1985, ApJ, 90, 422 [Google Scholar]
- Heber, U., Edelmann, H., Napiwotzki, R., Altmann, M., & Scholz, R.-D. 2008, A&A, 483, L21 [NASA ADS] [CrossRef] [EDP Sciences] [Google Scholar]
- Hesser, J. E., & Harris, G. L. H. 1979, ApJ, 234, 513 [NASA ADS] [CrossRef] [Google Scholar]
- Hill, V., Barbuy, B., Spite, M., et al. 2000, A&A, 353, 557 [NASA ADS] [Google Scholar]
- Hills, J. G. 1988, Nature, 331, 687 [Google Scholar]
- Hirsch, H. A., Herber, U., O’Toole, S. J., & Bresolin, F. 2005, A&A, 444, L61 [NASA ADS] [CrossRef] [EDP Sciences] [Google Scholar]
- Høg, E., Kuzmin, A., Bastian, U., Fabicius, C., & Kuimov, K. 1998, A&A, 335, L65 [NASA ADS] [Google Scholar]
- Høg, E., Fabricius, C., Makarov, V. V., Urban, S., & Corbin, T. 2000, A&A, 355, L27 [NASA ADS] [Google Scholar]
- Holmberg, J., Nordström, B., & Andersen, J. 2009, A&A, 501, 941 [NASA ADS] [CrossRef] [EDP Sciences] [Google Scholar]
- Huang, Y., Barts, S. A., & Halpern, J. B. 1992, J. Phys. Chem, 96, 425 [Google Scholar]
- Irrgang, A., Przybilla, N., Heber, U., Nieva, M. F., & Schuh, S. 2010, ApJ, 711, 138 [NASA ADS] [CrossRef] [Google Scholar]
- Johnson, D. R. H., & Soderblom, D. R. 1987, AJ, 93, 864 [NASA ADS] [CrossRef] [Google Scholar]
- Johnson, J. A., Ivans, I. I., & Stetson, P. B. 2006, ApJ, 640, 801 [NASA ADS] [CrossRef] [Google Scholar]
- Johnston, K. V., Hernquist, L., & Bolte, M. 1996, ApJ, 465, 278 [NASA ADS] [CrossRef] [Google Scholar]
- Jonsell, K., & Edvardsson, B. 2005, A&A, 440, 321 [NASA ADS] [CrossRef] [EDP Sciences] [Google Scholar]
- Kaufer, A., Stahl, O., Tubbesing, S., et al. 1999, The Messanger, 95, 8 [Google Scholar]
- Kenyon, S. J., Bromley, B. C., Geller, M. J., & Brown, W. R. 2008, ApJ, 680, 312 [NASA ADS] [CrossRef] [Google Scholar]
- Kepley, A. A., Morrison, H. L., Helmi, A., et al. 2007, AJ, 134, 1579 [NASA ADS] [CrossRef] [Google Scholar]
- Kharchenko, N. V., & Röser, S. 2009, VizieR On-line Data Catalog: I/280B [Google Scholar]
- King, D. S., & Lomb, N. R. 1983, Sydney Southern Star Catalogue, in J. Proc. R. Soc. New South Wales, 116, 53 [Google Scholar]
- Kurucz, R. L. 1993, CD-ROM 13, Atlas9 Stellar Atmosphere Programs and 2 km s-1 Grid (Cambridge: Smithsonian Astrophys. Obs) [Google Scholar]
- Lambert, D. L. 1981, The chemical composition of red giants – The first dredge-up phase, ed. I. Iben, & A. Renzini, in Physical Process in Red Giants (Dordrecht, D. Reidel Publ. Co.), 115 [Google Scholar]
- Lambert, D. L., Heath, J. E., Lemke, M., & Drake, J. 1996, ApJS, 103, 183 [NASA ADS] [CrossRef] [Google Scholar]
- Liang, Y. C., Zhao, G., Chen, Y. Q., Qiu, H. M., & Zhang, B. 2003, A&A, 397, 257 [NASA ADS] [CrossRef] [EDP Sciences] [Google Scholar]
- Lucatello, S., Gratton, R., Cohen, J. G., et al. 2003, AJ, 125, 875 [NASA ADS] [CrossRef] [Google Scholar]
- Luck, R. E., & Bond, H. E. 1991, ApJS, 77, 515 [NASA ADS] [CrossRef] [Google Scholar]
- MacConnell, D. J., Frye, R. L., & Upgren, A. R. 1972, AJ, 77, 384 [NASA ADS] [CrossRef] [Google Scholar]
- Martin, W. C., Fuhr, J. R., Kelleher, D. E., et al. 2002, NIST Atomic Spectra Database Version 2.0 (Online Available), NIST Standard Reference Database (Gaithersburg Maryland: National Institute of Standards and Technology) [Google Scholar]
- Masseron, T., van Eck, S., Famaey, B., et al. 2006, A&A, 455, 1059 [NASA ADS] [CrossRef] [EDP Sciences] [Google Scholar]
- Masseron, T., Johnson, J. A., Plez, B., et al. 2010, A&A, 509, 93 [Google Scholar]
- McClure, R. D., & Woodsworth, A. W. 1990, ApJ, 352, 709 [NASA ADS] [CrossRef] [Google Scholar]
- McWilliam, A. 1998, AJ, 115, 1640 [NASA ADS] [CrossRef] [Google Scholar]
- McWilliam, A., & Rich, R. M. 1994, ApJS, 91, 749 [NASA ADS] [CrossRef] [Google Scholar]
- McWilliam, A., Preston, G. W., Sneden, C., & Searle, L. 1995, AJ, 109, 275 [Google Scholar]
- Monet, D. G., Levine, S. E., Canzian, B., Ables, H. D., & Bird, A. R. 2003, AJ, 125, 984 [NASA ADS] [CrossRef] [Google Scholar]
- Munari, U., & Zwitter, T. 1997, A&A, 318, 269 [NASA ADS] [Google Scholar]
- Nissen, P. E., & Schuster, W. J. 2010, A&A, 511, L10 [NASA ADS] [CrossRef] [EDP Sciences] [Google Scholar]
- Nissen, P. E., Primas, F., Asplund, M., & Lambert, D. L. 2002, A&A, 390, 235 [NASA ADS] [CrossRef] [EDP Sciences] [Google Scholar]
- Norris, J., Bessell, M. S., & Pickles, A. J. 1985, ApJS, 58, 463 [NASA ADS] [CrossRef] [Google Scholar]
- North, P., Berthet, S., & Lanz, T. 1994, A&A, 281, 775 [NASA ADS] [Google Scholar]
- Ortega, V. G., de la Reza, R., Jilinski, E., & Bazzanella, B. 2002, ApJ, 575, L75 [NASA ADS] [CrossRef] [Google Scholar]
- Pereira, C. B. 2005, AJ, 129, 2469 [NASA ADS] [CrossRef] [Google Scholar]
- Pereira, C. B., & Drake, N. A. 2009, A&A, 496, 791 [NASA ADS] [CrossRef] [EDP Sciences] [Google Scholar]
- Pereira, C. B., & Drake, N. A. 2011, AJ, 141, 79 [NASA ADS] [CrossRef] [Google Scholar]
- Pereira, C. B., & Roig, F. 2009, AJ, 137, 118 [NASA ADS] [CrossRef] [Google Scholar]
- Pereira, C. B., Sales Silva, J. V., Chavero, C., Roig, F., & Jilinski, E. 2011, A&A, 533, 51 [Google Scholar]
- Perryman, M. A. C., & ESA 1997, in The Hipparcos and TYCHO catalogues. Astrometric and photometric star catalogues derived from the ESA Hipparcos Space Astrometry Mission, ESA SP, 1200 [Google Scholar]
- Pradhan, A. D., Partridge, H., & Bauschlicher, C. W. 1994, J. Chem. Phys., 101, 3857 [NASA ADS] [CrossRef] [Google Scholar]
- Preston, G. W., & Sneden, C. 2001, ApJ, 122, 1545 [Google Scholar]
- Przybilla, N., Tillich, A., Heber, U., & Scholz, R. D. 2010, ApJ, 718, 37 [NASA ADS] [CrossRef] [Google Scholar]
- Reddy, B. E., Bakker, E. J., & Hrivnak, B. J. 1999, ApJ, 524, 831 [NASA ADS] [CrossRef] [Google Scholar]
- Reddy, B. E., Tomkin, J., Lambert, D. L., & Allen de Prieto, C. 2003, MNRAS, 340, 304 [NASA ADS] [CrossRef] [Google Scholar]
- Röser, S., Schilbach, E., Schwan, H., et al. 2008, A&A, 488, 401 [NASA ADS] [CrossRef] [EDP Sciences] [Google Scholar]
- Ryan, S. G., & Lambert, D. L. 1995, AJ, 109, 2068 [NASA ADS] [CrossRef] [Google Scholar]
- Ryan, S. G., Norris, J. E., & Beers, T. C. 1996, ApJ, 471, 254 [NASA ADS] [CrossRef] [Google Scholar]
- Sakamoto, T., Chiba, M., & Beers, T. C. 2003, A&A, 397, 899 [NASA ADS] [CrossRef] [EDP Sciences] [Google Scholar]
- Schuster, W. J., Moitinho, A., Marquez, A., Parrao, L., & Covarrubias, E. 2006, A&A, 445, 939 [NASA ADS] [CrossRef] [EDP Sciences] [Google Scholar]
- Siebert, A., Williams, M., Siviero, A., et al. 2011, AJ, 141, 187 [NASA ADS] [CrossRef] [Google Scholar]
- Sivarani, T., Bonifacio, P., Molaro, P., et al. 2004, A&A, 413, 1073 [NASA ADS] [CrossRef] [EDP Sciences] [Google Scholar]
- Smith, G., Edvardsson, B., & Frisk, U. 1986, A&A, 165, 126 [NASA ADS] [Google Scholar]
- Smith, V. V., Coleman, H., & Lambert, D. L. 1993, ApJ, 417, 287 [NASA ADS] [CrossRef] [Google Scholar]
- Smith, V. V., Cunha, K., Jorissen, A., & Boffin, H. M. J. 1996, A&A, 315, 179 [NASA ADS] [Google Scholar]
- Smith, V. V., Cunha, K., Jorissen, A., & Boffin, H. M. J. 1997, A&A, 324, 97 [NASA ADS] [Google Scholar]
- Smith, M. C., Ruchti, G. R., Helmi, A., et al. 2007, MNRAS, 380, 805 [NASA ADS] [CrossRef] [Google Scholar]
- Sneden, C. 1973, Ph.D. Thesis, Univ. of Texas [Google Scholar]
- Sneden, C., McWilliam, A., Preston, G. W., & Cowan, J. J. 1996, ApJ, 467, 819 [NASA ADS] [CrossRef] [Google Scholar]
- Thompson, I. B., Ivans, I. I., Bisterzo, S., et al. 2008, ApJ, 677, 556 [NASA ADS] [CrossRef] [Google Scholar]
- Tillich, A., Przybilla, N., Scholz, R.-D., & Heber, U. 2009, A&A, 507, L37 [NASA ADS] [CrossRef] [EDP Sciences] [Google Scholar]
- Tillich, A., Przybilla, N., Scholz, R.-D., & Heber, U. 2010, A&A, 517, A36 [NASA ADS] [CrossRef] [EDP Sciences] [Google Scholar]
- Tillich, A., Heber, U., Geier, S., et al. 2011, A&A, 527, A137 [NASA ADS] [CrossRef] [EDP Sciences] [Google Scholar]
- Tomkin, J., & Lambert, D. L. 1984, ApJ, 279, 220 [NASA ADS] [CrossRef] [Google Scholar]
- Urban, S. E., Corbin, T. E., & Wycoff, G. L. 1998, AJ, 115, 2161 [NASA ADS] [CrossRef] [Google Scholar]
- van Leeuwen, F. 2007, in Hipparcos, the New Reduction of the Raw Data, Astrophys. Space Sci. Libr., 350 [Google Scholar]
- Van Winckel, H., & Reyniers, M. 2000, A&A, 354, 135 [NASA ADS] [Google Scholar]
- Van Eck, S., Goriely, S., Jorissen, A., & Plez, B. 2003, A&A, 404, 291 [NASA ADS] [CrossRef] [EDP Sciences] [Google Scholar]
- Vanture, A. 1992a, AJ, 103, 2035 [NASA ADS] [CrossRef] [Google Scholar]
- Vanture, A. 1992b, AJ, 104, 1986 [NASA ADS] [CrossRef] [Google Scholar]
- Venn, K. A., Tolstoy, E., Kaufer, A., et al. 2003, AJ, 126, 1326 [NASA ADS] [CrossRef] [Google Scholar]
- Wiese, W. L., & Martin, G. A. 1980, Wavelengths and transition probabilities for atoms and atomic ions: Part 2. Transition probabilities, NSRDS-NBS, 68 [Google Scholar]
- Wylie-de Boer, E., Freeman, K., & Williams, M. 2010, AJ, 139, 645 [Google Scholar]
- Zacharias, N., Finch, C., Girard, T., et al. 2009, UCAC3 Catalogue (VizieR On-line Data Catalog I/315) [Google Scholar]
All Tables
Chemical abundances derived for CD-62°1346 in the scale log ε(H) = 12.0 and in the notations [X/H] and [X/Fe].
Mass, distance, total Galactic reference frame velocity (VGRF) and the escape velocity vesc calculated for the different stellar masses.
Atmospheric parameters (effective temperature and surface gravity), distance, radial velocity (RV), space velocity components relative to the Sun (U0, V0, W0), and the Galactic rest frame velocity (VGRF) for some metal-poor barium and CH stars.
All Figures
|
Fig. 1 Spectrum of CD-62°1346. Short dashed vertical lines show the transitions of Fe i 6137.70, Ba ii 6141.73 and Ca i 6162.12. The spectral lines are redshifted by about 2.6 Å due to a radial velocity of 126.5 km s-1. |
| In the text | |
|
Fig. 2 Abundance pattern of CD-62°1346. Error bars represent the uncertainty estimates described in the text. |
| In the text | |
|
Fig. 3 [O/Fe] versus [Fe/H] for CD-62°1346 (black circle), disk stars (blue circles), CEMP-s stars (red circles), and CEMP-no stars (green triangles). Abundance data for the disk stars are taken from Edvardsson et al. (1993) and Nissen et al. (2002). Abundance data for CEMP-no stars are taken from Cayrel et al. (2004) and from Masseron et al. (2010) and abundance data for CEMP-s stars are taken from Masseron et al. (2010). |
| In the text | |
|
Fig. 4 Diagram of [s/Fe] versus [Fe/H] for several classes of chemically peculiar binary stars. Barium giants (red open squares); CH stars (blue open polygons); subgiant CH stars (red plus signs); yellow-symbiotics (green filled diamonds); CEMP stars that are members of binary systems (red filled circles). The position of CD-62°1346 is marked by a black filled circle. Abundance data for barium giant and dwarf stars are taken from Allen & Barbuy (2006), Antipova et al. (2004), Liang et al. (2003), North et al. (1994), Smith et al. (1993), Drake & Pereira (2008), Pereira (2005), Pereira & Drake (2009, 2011); CH stars are taken from Vanture (1992b) and Van Eck et al. (2003); yellow symbiotics are taken from Smith et al. (1996, 1997) and Pereira & Roig (2009). The solid line is the mean ⟨ [s/Fe] ⟩ for field stars (Gratton & Sneden 1994; Ryan et al. 1996; François et al. 2003). |
| In the text | |
|
Fig. 5 Diagram of [C/Fe] versus [Fe/H] for several classes of chemically peculiar binary stars. Symbols have the meaning as in Fig. 4. The solid line is the mean ⟨ [C/Fe] ⟩ for field stars, taken from Masseron et al. (2006). |
| In the text | |
|
Fig. 6 Observed (dots) and synthetic (lines) spectra of CD-62°1346 in the region around the Pb i line at λ4057.8 Å. The synthetic spectra are shown for lead abundances of log ε(Pb) = 2.21, 2.41, and 2.61. The upper line shows a synthesis without contribution from the Pb i and CH lines. |
| In the text | |
|
Fig. 7 Behavior of the [Pb/Ce] ratio with metallicity. Symbols have the same meaning as in Fig. 4. The solid line represents the prediction from the standard partial mixing (PM) model as given by Goriely & Mowlavi (2000). We considered only those CEMP-s stars that have already been proven to be binary systems. |
| In the text | |
|
Fig. 8 V − U diagram for CD-62°1346 (red filled circle) and other CH stars, BD+04°2466, HD 5223 and Feh-Duf (black filled circles). We also show the positions of five hypervelocity stars (blue filled circles). The stars from Holmberg et al. (2009) serve as reference. Black “x” points represent stars with distances from the Galactic plane less than 1 kpc, while blue “x” points represent those above 1 kpc from the Galactic plane. |
| In the text | |
|
Fig. 9 CD-62°1346, BD+04°2466, Feh-Duf, SDSS J130005.62 + 042201.6 and SDSS 121150.27 + 14376.2 in the e − Jz diagram. Other symbols have the same meaning as in Fig. 8. |
| In the text | |
|
Fig. 10 Trajectory of CD-62°1346 (red) and HD 5223 (blue) in the XY plane. For CD-62°1346 we show the whole trajectory from −2 Gyr to 2 Gyr in time, while for HD 5223 we show only a part of it from −0.5 Gyr to 0.5 Gyr. The whole trajectory calculated from −2 Gyr to 2 Gyr extends from (X,Y) = (600,260) to (X,Y) = (−470, −430). |
| In the text | |
|
Fig. 11 Same as in Fig. 10 but in the YZ plane. For HD 5223 the whole trajectory extends from (Z,Y) = ( − 30,260) to (Z,Y) = (110, − 400). |
| In the text | |
|
Fig. 12 Trajectory of BD+04°2466 (red) and Feh-Duf (blue) in the XY plane. We show the orbits from −2 Gyr to the present position labeled with “X”. We also show the position of the Sun. |
| In the text | |
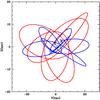 |
Fig. 13 Same as in Fig. 12 but in the YZ plane. |
| In the text | |
Current usage metrics show cumulative count of Article Views (full-text article views including HTML views, PDF and ePub downloads, according to the available data) and Abstracts Views on Vision4Press platform.
Data correspond to usage on the plateform after 2015. The current usage metrics is available 48-96 hours after online publication and is updated daily on week days.
Initial download of the metrics may take a while.