Fig. 2
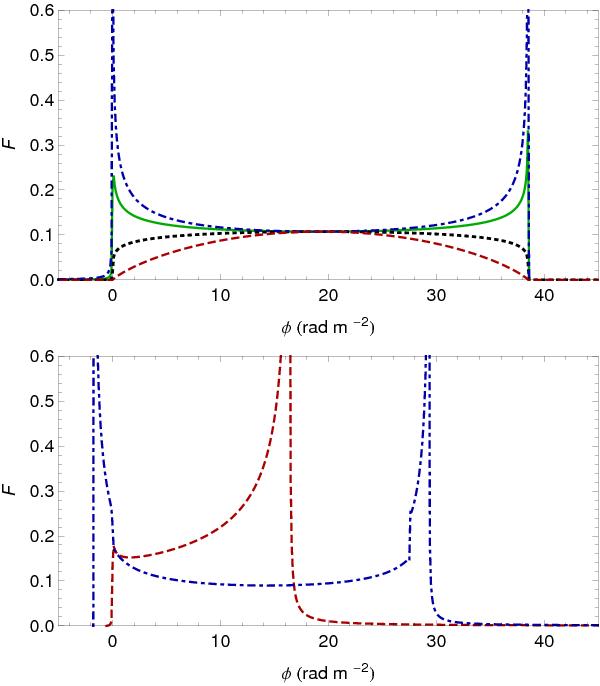
Several typical examples of the Faraday spectrum in Faraday depth space F(φ). Top: Gaussian magnetic field distribution for four different models (see Table 2): solid green line (model 1); dashed black line (model 2); dashed red line (model 3); dot-dashed blue line (model 4). Bottom: the case of magnetic field reversals and model 1): one reversal (dot-dashed blue line); two reversals (dashed red line).
Current usage metrics show cumulative count of Article Views (full-text article views including HTML views, PDF and ePub downloads, according to the available data) and Abstracts Views on Vision4Press platform.
Data correspond to usage on the plateform after 2015. The current usage metrics is available 48-96 hours after online publication and is updated daily on week days.
Initial download of the metrics may take a while.