Fig. 2
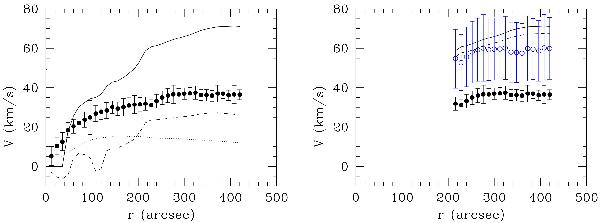
Left: MOND mass model of Holmberg II assuming the rotation curve presented by Oh et al. (2011). The dotted line is the contribution of the stellar disk assuming a M/L ratio in the 3.6 μm band of 0.39, the dashed line is the gas disk contribution, and the black line is the MOND prediction using a distance of 3.4 Mpc (Karachentsev et al. 2002). Right: rotation curve of Holmberg II beyond 210 arcsec. The black points and the solid line are the same as in the left panel, and the dashed line is the MOND prediction using a distance of 3.05 Mpc (Hoessel et al. 1998). The blue errorbars represent the range of outer rotation velocities derived in the present paper and for the blue open circles we assumed a velocity that is at the middle of the allowed range.
Current usage metrics show cumulative count of Article Views (full-text article views including HTML views, PDF and ePub downloads, according to the available data) and Abstracts Views on Vision4Press platform.
Data correspond to usage on the plateform after 2015. The current usage metrics is available 48-96 hours after online publication and is updated daily on week days.
Initial download of the metrics may take a while.