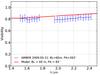
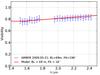
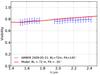
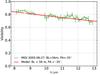
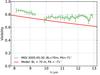
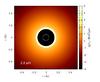
Fig. 4
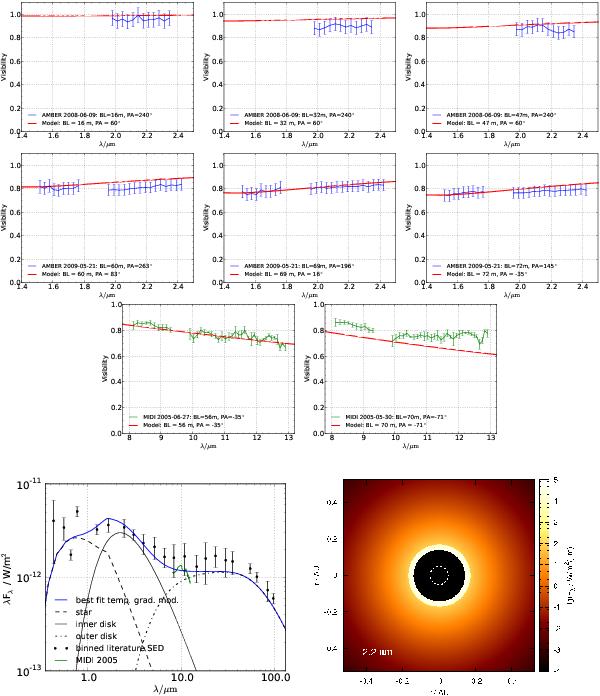
Temperature-gradient model C of S CrA N – two top rows: NIR visibility. The model that fits visibility and SED simultaneously (model C in Table 4) is indicated with the solid red lines. The six figures show the modeling of the data sets I (top) and II (bottom), described in Table 2. Third row: MIDI visibility. The two figures show the comparison between our model (red line) and MIR data adopted from Schegerer et al. (2009). Bottom left: spectral energy distribution. To model the SED of S CrA N, we collected values from the literature and binned them (black dots are the dereddened SED points, see Appendix A). The green line represents the MIDI spectrum of Schegerer et al. (2009). The SED of model C is indicated with the blue line. It consists of the stellar contribution (Kurucz model, black dashed line) plus the contribution of two additional ring-like structures (black solid and dash-dotted line). Bottom right: intensity distribution of the temperature-gradient disk of model C. The dashed white ring indicates the expected dust sublimation radius of 0.05 AU predicted by the size-luminosity-relation (see Sect. 4).

Current usage metrics show cumulative count of Article Views (full-text article views including HTML views, PDF and ePub downloads, according to the available data) and Abstracts Views on Vision4Press platform.
Data correspond to usage on the plateform after 2015. The current usage metrics is available 48-96 hours after online publication and is updated daily on week days.
Initial download of the metrics may take a while.