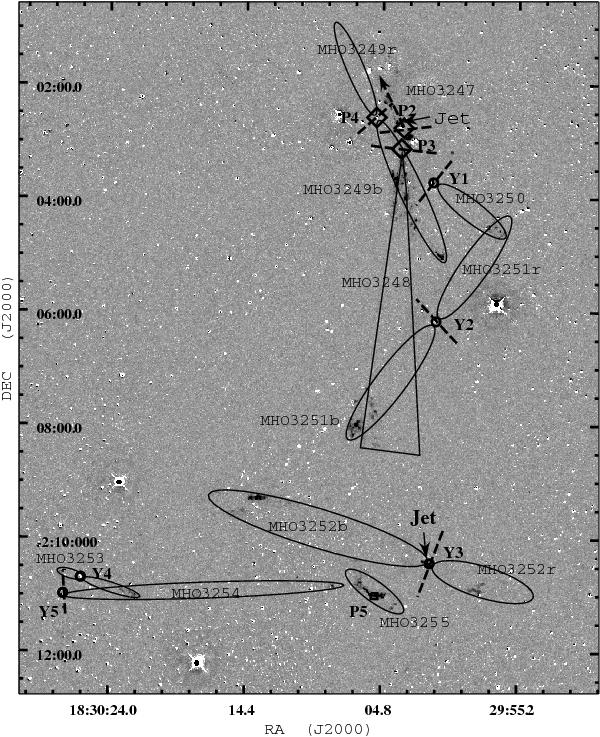
Fig. 1

Continuum-subtracted H2 image of the southern part of the observed region, displayed with logarithmic scales. The sources are marked according to the following: diamonds represent Class 0 stars from Bontemps et al. (2010), circles are Class I from Bontemps et al. (2010), and the square is a candidate Class 0 observed only in Spitzer 24 μm , the labels P2, P3, P4, P5, Y1, Y2, Y3, Y4, and Y5 are the names we used to refer to each source throughtout our work. For more on the outflows and driving sources, see Table 1. As dashed lines, we also show the polarization vectors (Sugitani et al. 2011).
Current usage metrics show cumulative count of Article Views (full-text article views including HTML views, PDF and ePub downloads, according to the available data) and Abstracts Views on Vision4Press platform.
Data correspond to usage on the plateform after 2015. The current usage metrics is available 48-96 hours after online publication and is updated daily on week days.
Initial download of the metrics may take a while.


