Fig. 9
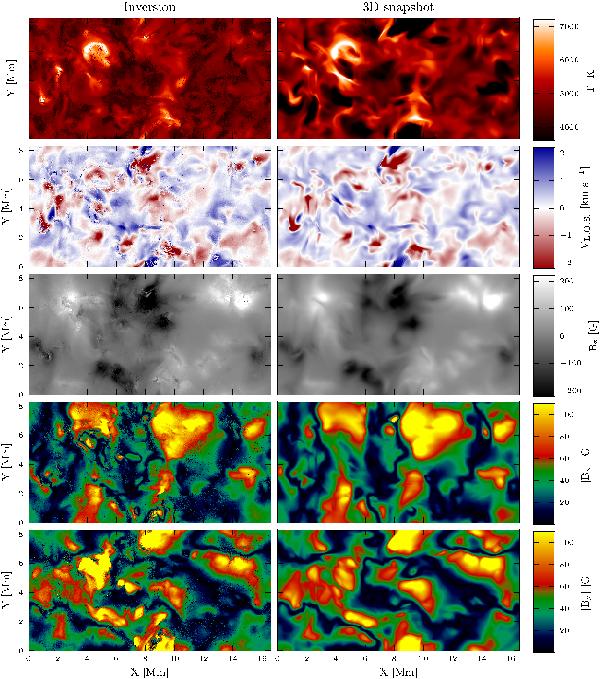
Full field-of-view comparison between physical quantities in the chromosphere as determined from the NLTE inversion (left) and the original 3D snapshot (right). From top to bottom: temperature, line-of-sight velocity, Bz, |Bx| and |By|. The line profiles were degraded with an instrumental profile of FWHM = 50 mÅ before carrying out the inversion. In the velocity panel, upflows have positive sign.
Current usage metrics show cumulative count of Article Views (full-text article views including HTML views, PDF and ePub downloads, according to the available data) and Abstracts Views on Vision4Press platform.
Data correspond to usage on the plateform after 2015. The current usage metrics is available 48-96 hours after online publication and is updated daily on week days.
Initial download of the metrics may take a while.