Fig. 8
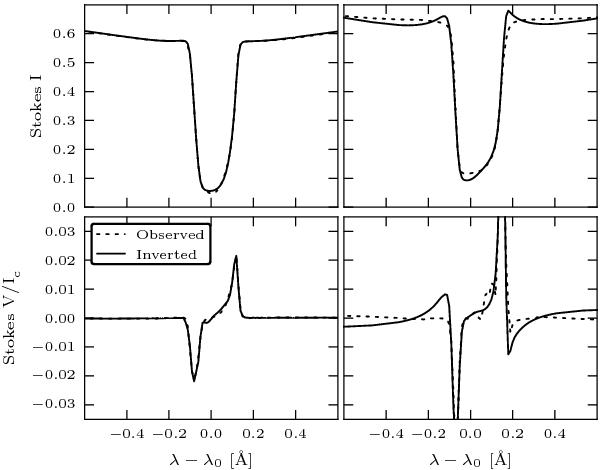
Illustrative examples of the fits (solid line) to the simulated observations (dashed line) at two different locations in the LTE inversion of Fig. 14. Left panels: a good fit, at pixel coordinates (25, 23) in Fig. 14. Right panels: a comparatively poorer fit at pixel coordinates (39, 34). Upper row: Stokes I (normalized to the average continuum intensity). Lower row: StokesV.
Current usage metrics show cumulative count of Article Views (full-text article views including HTML views, PDF and ePub downloads, according to the available data) and Abstracts Views on Vision4Press platform.
Data correspond to usage on the plateform after 2015. The current usage metrics is available 48-96 hours after online publication and is updated daily on week days.
Initial download of the metrics may take a while.