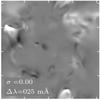
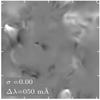
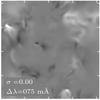
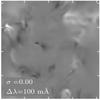
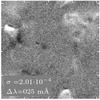
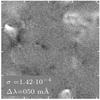
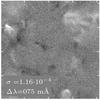
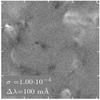
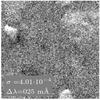
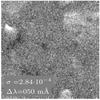
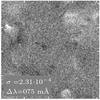
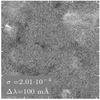
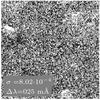
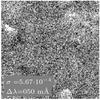
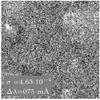
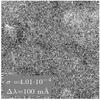
Fig. 6
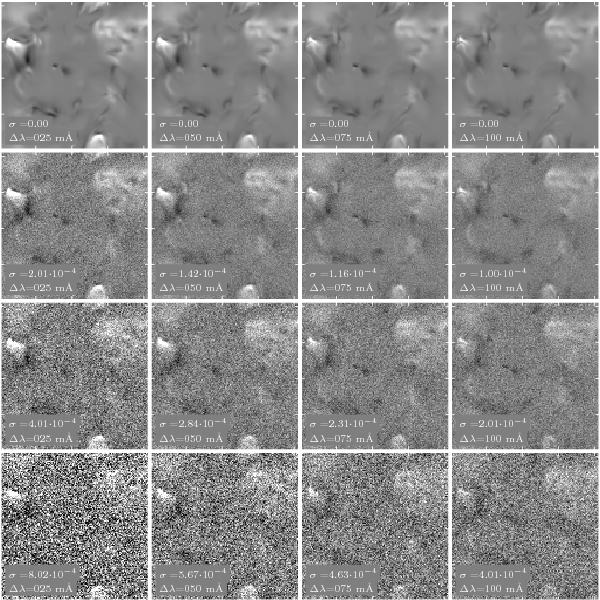
Stokes Q image spectrally degraded with Gaussian PSFs and random noise. From left to right, the spectral degradation increases as a function of the FWHM of the Gaussian, from Δλ = 25 mÅ to Δλ = 100 mÅ. From top to bottom, the integration time is ∞, 16 s, 4 s and 1 s, respectively. The images are scaled to ± 0.15% relative to the continuum intensity. For a fixed exposure time the noise in each image increases with decreasing width of the instrumental profile.
Current usage metrics show cumulative count of Article Views (full-text article views including HTML views, PDF and ePub downloads, according to the available data) and Abstracts Views on Vision4Press platform.
Data correspond to usage on the plateform after 2015. The current usage metrics is available 48-96 hours after online publication and is updated daily on week days.
Initial download of the metrics may take a while.