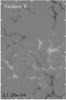
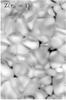
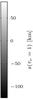
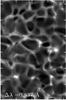
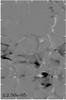
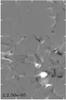
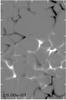
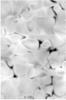
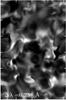
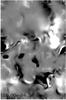
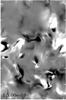
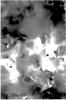
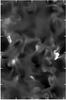
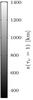
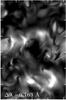
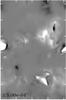
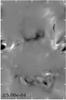
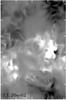
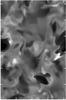
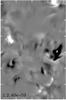
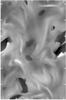
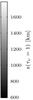
Fig. 3
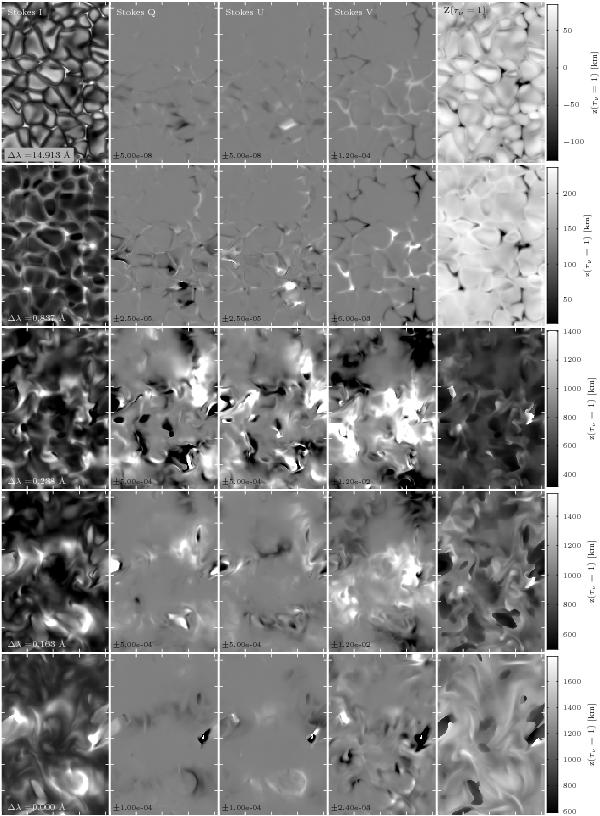
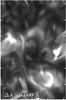
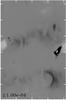
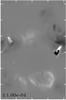
Synthetic full-Stokes images computed from a 12.45 × 8.3 Mm patch of the model. From left to right, the first 4 columns show monochromatic Stokes I, Q, U and V images, respectively. The last column shows the height where the monochromatic optical depth equals one. From top to bottom, the wavelength decreases from the far red wing to the core of the line. The wavelength relative to line core is indicated on each of the Stokes I panels. The Stokes Q, U and V panels have been scaled independently to enhance visibility of weak polarization features; the scale range is indicated within each panel in units of the continuum intensity. The tick-mark separation is 2 Mm. The panels have been transposed with respect to the panel orientation of Fig. 1.
Current usage metrics show cumulative count of Article Views (full-text article views including HTML views, PDF and ePub downloads, according to the available data) and Abstracts Views on Vision4Press platform.
Data correspond to usage on the plateform after 2015. The current usage metrics is available 48-96 hours after online publication and is updated daily on week days.
Initial download of the metrics may take a while.