Free Access
Fig. 22
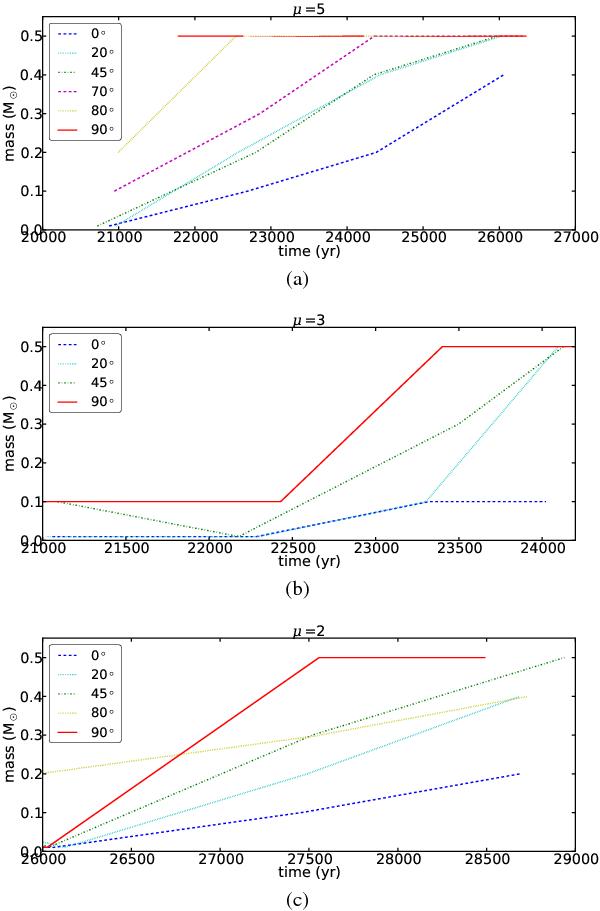
Observational estimate of the mass of the “disk” for μ = 5 (a)), μ = 3 (b)), and μ = 2 (c)). These masses are inferred using a comparison between our simulations and analytical density profiles for the envelope, the outflows, and the disk (see text).
This figure is made of several images, please see below:
Current usage metrics show cumulative count of Article Views (full-text article views including HTML views, PDF and ePub downloads, according to the available data) and Abstracts Views on Vision4Press platform.
Data correspond to usage on the plateform after 2015. The current usage metrics is available 48-96 hours after online publication and is updated daily on week days.
Initial download of the metrics may take a while.