Free Access
Fig. 12
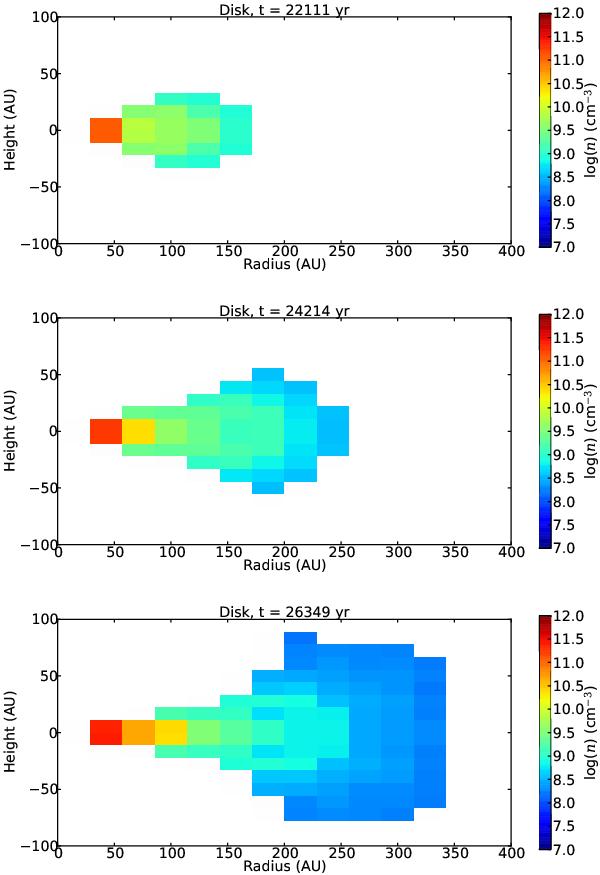
Density map on a logarithmic scale in the disk for μ = 5,α = 90°, for three different time-steps. The disk grows with time as the central part becomes denser; the maximum radius corresponds to the edge of the spiral arms of the disk structure.
This figure is made of several images, please see below:
Current usage metrics show cumulative count of Article Views (full-text article views including HTML views, PDF and ePub downloads, according to the available data) and Abstracts Views on Vision4Press platform.
Data correspond to usage on the plateform after 2015. The current usage metrics is available 48-96 hours after online publication and is updated daily on week days.
Initial download of the metrics may take a while.