| Issue |
A&A
Volume 543, July 2012
|
|
|---|---|---|
| Article Number | A61 | |
| Number of page(s) | 16 | |
| Section | Extragalactic astronomy | |
| DOI | https://doi.org/10.1051/0004-6361/201117568 | |
| Published online | 27 June 2012 | |
High resolution IR observations of the starburst ring in NGC 7552
One ring to rule them all?⋆
1 Leiden Observatory, Leiden University, PO Box 9513, 2300 RA Leiden, The Netherlands
e-mail: This email address is being protected from spambots. You need JavaScript enabled to view it.
2 Instituto de Astrofísica de Canarias, vía Láctea s/n, 38205 La Laguna, Spain
3 Departamento de Astrofísica, Universidad de La Laguna, 38205 La Laguna, Tenerife, Spain
4 Geneva Observatory, University of Geneva, 51 Ch. des Maillettes, 1290 Versoix, Switzerland
5 CNRS, IRAP, 9 Av. colonel Roche, BP 44346, 31028 Toulouse Cedex 4, France
Received: 26 June 2011
Accepted: 1 May 2012
Abstract
Aims. Approximately 20% of all spiral galaxies display starburst activity in nuclear rings of a few hundred parsecs in diameter. It is our main aim to investigate how the starburst ignites and propagates within the ring, leading to the formation of massive stellar clusters.
Methods. We observed the ring galaxy NGC 7552 with the mid-infrared (MIR) instrument VISIR at an angular resolution of 0 3–04 and with the near-infrared (NIR) integral-field spectrograph SINFONI on the VLT, and complement these observations with data from ISO and Spitzer.
Results. The starburst ring is clearly detected at MIR wavelengths at the location of the dust-extincted, dark ring seen in HST observations. This “ring”, however, is a rather complex annular region of more than 100 parsec width. We find a large fraction of diffuse [Ne ii] and PAH emission in the central region that is not associated with the MIR peaks on spatial scales of ~30 pc. We do not detect MIR emission from the nucleus of NGC 7552, which is very prominent at optical and NIR continuum wavelengths. However, we have identified nine unresolved MIR peaks within the ring. The average extinction of these peaks is AV = 7.4 and their total infrared luminosity is LIR = 2.1 × 10¹⁰ L⊙. The properties of these peaks are typical for MIR-selected massive clusters found in other galaxies. The ages of the MIR-selected clusters are in the range of 5.9 ± 0.3 Myr. The age spread among the clusters of 0.8 Myr is small compared to the travel time of ~5.6 Myr for half an orbit within the starburst ring. We find no strong evidence for a scenario where the continuous inflow of gas leads to the ongoing formation of massive clusters at the contact points between galactic bar and starburst ring. Instead, it appears more likely that the gas density build up more gradually over larger ring segments, and that the local physical conditions govern cluster formation. We note that the fundamental limitation on the accurate derivation of cluster age, mass and initial mass function slope is the lack of higher angular resolution. Resolving the highly embedded, massive clusters requires milli-arcsecond resolution at infrared wavelengths, which will be provided by the next generation of instruments on extremely large telescopes (ELTs).
Key words: ISM: kinematics and dynamics / HII regions / galaxies: nuclei / galaxies: starburst / galaxies: star clusters: general / infrared: ISM
SINFONI data cubes are only available at the CDS via anonymous ftp to cdsarc.u-strasbg.fr (130.79.128.5) or via http://cdsarc.u-strasbg.fr/viz-bin/qcat?J/A+A/543/A61
© ESO, 2012
1. Introduction
Massive star formation in galaxies occurs in various appearances and modes, from localised H II regions and blue compact dwarf galaxies to luminous starbursts in ultra-luminous infrared galaxies (ULIRGs) and sub-millimeter galaxies. One particularly interesting starburst mode shows a ring-like morphology around the galactic nucleus (e.g., Sarzi et al. 2007; Böker et al. 2008; Mazzuca et al. 2008). These systems are not uncommon – in approximately 20% of all spiral galaxies star-formation occurs primarily in these rings of typically a few hundred parsecs in diameter (Knapen 2005). These large structures of intense star formation are primarily found in barred spiral galaxies of types Sa-Sbc. In fact, bars are expected to account for about 3.5 times more triggered central star formation than galaxy interactions (Ellison et al. 2011). Strong magnetic fields (105 μG in the ring of NGC 7552, Beck 2011) are likely to create magnetic stress that causes inflow of gas toward the center.
The key question is under what conditions the large amounts of gas and dust, necessary to form the massive young star clusters, accumulate and concentrate in these ring-like structures. Unfortunately, the situation is not clear, partially due to the lack of high resolution observations at longer wavelengths and partially due to the complexity of the dynamics of gas and dust, and hence several scenarios have been discussed in the literature.
According to Shlosman et al. (1990), the torque from the large-scale bar weakens near its centre where the influence of the bulge begins to dominate the disk potential. The gas concentrates in ring-like resonances where the gas is free of gravitational torques. In contrast, Kenney et al. (1993) explain the rings as a consequence of a previous nuclear starburst which has used up the gas in the centre, leaving the nuclear ring as a remnant. Recently, Väisänen et al. (2012) reported on an outward propagating ring of star formation in NGC 1614 resulting from a relatively major merger event.
Arguably the most common explanation is that the gas accumulates during the inflow around the radii at which the stellar orbits experience dynamical resonances with the rotating bar potential (e.g., Binney & Tremaine 2008). In the central region this typically happens at the so-called inner Lindblad resonance (ILR), arising from the interplay between the bar and the stellar orbits (e.g., Telesco et al. 1993; Buta & Combes 1996; Böker et al. 2008). The gas is trapped between an inner ILR and an outer ILR. If the potential allows only one ILR, the gas will concentrate directly at the ILR, if the system has two ILRs, the gas will accumulate at the inner ILR – (see review by Buta & Combes 1996,for more details).
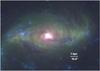 |
Fig. 1 Colour composite of NGC 7552 made from images provided by the SINGS team (Kennicutt et al. 2003) in H-α (blue), and the B and I bands (green and red, respectively), taken on the CTIO 1.5 m telescope. North is up and east to the left. A scale bar indicating angular and absolute distances is also shown. |
However, more recently Regan & Teuben (2003) claimed that the common assumption that nuclear rings are related to an ILR is incorrect, and showed in simulations that there is no resonance at the inner Lindblad resonance in barred galaxies. They argue that confusion has developed between the orbit family transition that occurs at these radii in weak bars and a true resonance. Furthermore, Regan & Teuben (2003) found that the radius of nuclear rings decreases with time, either because the rings accumulate lower specific angular momentum gas or because of dissipation at the contact point of the bar dust lane and the nuclear ring.
Obviously, observations may be able to provide further insights. A very good example of a starburst ring galaxy is NGC 7552, a nearly face-on, barred spiral galaxy at an inclination of ~28° (Feinstein et al. 1990). Originally classified as amorphous (Sérsic & Pastoriza 1965) it appears in the RC3 catalogue (de Vaucouleurs et al. 1991) as morphological type SB(s)ab and in the RSA catalogue (Sandage & Tammann 1981) as type SBbc(s). Both designations indicate a barred spiral (SB) galaxy with spiral arms that spring from the ends of a bar (s), and an outer ring (R’). Figure 1 shows a 3-color image of NGC 7552 to illustrate the global morphology and the relevant scales. Throughout this paper we assume a distance of 19.5 Mpc (Tully & Fisher 1988); at this distance, 1′′ corresponds to 95 pc.
NGC 7552 has been previously classified as a LINER galaxy, based on the [O I]λ6300 line (Durret & Bergeron 1988). Neither X-ray (Liu & Bregman 2005) nor NIR observations (Forbes et al. 1994a) did reveal significant activity from a galactic nucleus. In fact, models of gas flow in barred galaxies (Piner et al. 1995) have shown that the gas flow, necessary to fuel an active galactic nucleus, can be interrupted by a nuclear ring. The global spectral energy distribution (SED), from UV to radio, is well characterised (e.g., Dale et al. 2007). From the IRAS colours of the entire galaxy, Sanders et al. (2003) estimated a total infrared luminosity of 8.5 × 10¹⁰ L⊙ (adjusted for the assumed distance).
Several previous studies (e.g., Feinstein et al. 1990; Forbes et al. 1994b; Schinnerer et al. 1997; Siebenmorgen et al. 2004; van der Werf et al. 2006) provided strong evidence for a starburst ring in the centre of NGC 7552 (Sect. 3.1). While the macroscopic picture of how these rings form seems well established, the morphology of the central region and the microscopic picture of how, when and where the starburst ignites and propagates are rather uncertain and require more and better observational constraints. It is the main aim of this paper to investigate these details.
MIR observations provide excellent diagnostics to detect embedded clusters1 (e.g. Gorjian et al. 2001; Beck et al. 2002; Vacca et al. 2002) and quantify massive star formation (e.g. Genzel & Cesarsky 2000; Peeters et al. 2004). Previous studies of NGC 7552 at MIR wavelengths have been severly limited in spatial resolution, with angular resolutions of 0.8′′ − 1′′ (Schinnerer et al. 1997; Siebenmorgen et al. 2004) and ~4′′ (Dale et al. 2007). The availability of the VLT Spectrometer and Imager for the Mid-Infrared (VISIR) at the ESO VLT, makes it possible to study galaxies in the N band (8–13 μm) at an angular resolution of 03 under excellent seeing conditions2.
Spectral properties and the measured flux densities in units of mJy through the nine used VISIR filters.
In this paper we complement our mid-IR data with NIR images at similar angular resolution. The latter data were taken with SINFONI, a NIR integral-field spectrograph at the ESO VLT. Combining near- and mid-IR photometry will provide essential information on both, the stellar sources that provide most of the energy output, and their dusty, re-radiating environment. The observations presented here, with their unprecedented high angular resolution, will allow us to study the morphology of the starburst ring, the distribution and properties of its star clusters, and their formation history.
This paper is structured as follows. Section 2 describes the observations and data reduction. Section 3 presents the photometric and spectroscopic results, and Sect. 4 provides a detailed discussion of our results. Finally, Sect. 5 summarises our main conclusions.
2. Observations and data reduction
2.1. VISIR
2.1.1. Imaging
The imaging data were acquired with the VLT Imager and Spectrograph for the mid-IR (VISIR, Lagage et al. 2004; Pantin et al. 2005), mounted at the Cassegrain focus of the VLT Unit Telescope 3, Melipal. The data were obtained in period of March 2005 to January 2006 in nine different filters. Table 1 lists the relevant filters, their central wavelengths and spectral widths. A cross-comparison with the spectro-photometry (Sect. 2.1.2) shows overall very good agreement in eight narrow and broad-band filters, but with the exception of the SIV_1 filter, in which the measured flux density appears to be about 60% too high (see Fig. 4). However, the 9.73–9.91 μm SIV_1 filter has intrinsically very low transmission, resulting in a four times lower nominal sensitivity with respect to comparable VISIR filters3, and was thus not included in the analysis.
The data were acquired in service mode queued observations under stable weather conditions with an optical seeing of ≤ 08 and an air mass ≤ 1.5. We selected the pixel scale of 0127 pixel-1, which provides a total FOV of 323 × 323. The observations were performed using the standard chopping and nodding technique, which removes the time-variable sky background, telescope thermal emission and most of the so-called 1/f noise. We used a chopper throw of 30′′. All observations were bracketed by photometric standard star observations. We note that the chopping/nodding technique, while effectively reducing the background, may also eliminate any large-scale diffuse nebular emission from the region. VISIR imaging, however, recovers nearly 50% of the total [Ne ii] line flux measured by Spitzer (Table 3) and hence we do not consider chopping/nodding to introduce a significant source of systematic photometric errors.
The final images are the result of shifting and combining the individual chopping cycles and were obtained using the VISIR pipeline (version 1.3.7). Practically all of the final images showed some stripes due to high-gain pixels. We removed these stripes using the reduction routine destripe (Snijders, private communication), which is written in IDL. The conversion from counts to physical flux units was derived from the photometric standards HD 216032 and HD 218670. The angular resolution varies between 03 and 04, very close to the diffraction limit of VLT at 10 μm.
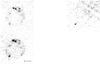 |
Fig. 2 Left: continuum subtracted [Ne ii][12.8 μm] line image. Center: 8.6 μm PAH image Right: 12 μm continuum images taken in the SiC filter. The PAH image suffers from fixed pattern noise, but shows one bright peak, M7. All three images are displayed in linear intensity scaling; north is up and east is to the left. The bar indicates a scale of 2′′ or 190 pc. |
Figure 2 illustrates the image quality of the resulting maps in the continuum subtracted [Ne ii][12.8 μm] line, the 8.6 μm feature of polycyclic aromatic hydrocarbons (PAHs) and the MIR continuum. Although the PAH map suffers from fixed pattern noise, the [Ne ii] and continuum maps illustrate the significant improvement in comparison to previous mid-IR observations (e.g., Schinnerer et al. 1997, Fig. 4).
Absolute and relative coordinates of the MIR peaks with respect to the radio nucleus (Nuc) from Forbes et al. (1994b).
The starburst ring and several individual knots are clearly visible in the 12.8 μm filter image in Fig. 3a. We have identified nine unresolved peaks, which we label M1 to M9. The positions of these peaks are listed in Table 2. For each VISIR filter, the fluxes of each knot were measured performing aperture photometry within circular apertures with a diameter of 07, about twice the resolution limit. The photometric fluxes are all tabulated in Table 1. M1 and M2 are the brightest knots, clearly detected in all the VISIR filters. The quoted uncertainties are those derived from the aperture photometry. The summed contribution of all the individual knots (ΣMi) and the total photometry obtained within an 3′′–8′′ annulus that covers the starburst ring (Sect. 3.1) are also listed.
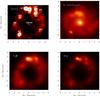 |
Fig. 3 a) Upper left: VISIR image taken in the 12.8 μm filter. The 1 − σ RMS is approximately 0.57 mJy pixel-1. The plus signs indicate the locations of the MIR peaks M1 through M9, discussed in this paper. b) Upper right: K-band continuum image of NGC 7552, composed from the reconstructed SINFONI data cube. c) Lower left: reconstructed and continuum subtracted SINFONI Pa-β image. d) Lower right: reconstructed and continuum subtracted SINFONI Br-γ image. All four figures indicate the image scale in arcseconds (1″ corresponds to 95 pc) with respect to the radio continuum center (see Table 2 and Sect. 2.4). |
Physical properties of the clusters M1–M9 derived from 07 apertures centered on the mid-IR peaks.
The [Ne ii] 12.8 μm line emission of the individual clusters has been estimated from the “NeII_1”, “NeII” and “NeII_2” narrow-band filters. We interpolated the continuum level at the central wavelength of the “NeII” filter (12.8 μm) from the “NeII_1” and “NeII_2” filters. The resulting [Ne ii] line fluxes are listed in Table 3.
Similarly, we have obtained approximate measurements of the 8.6 μm emission feature of PAHs. The three most luminous peaks in the “PAH_1” filter are the mid-IR sources M1, M2 and M7. Here we have only used the “ArIII” filter to measure the continuum level and assumed a flat continuum in Fν. The results are listed in Table 5. With only one data point to constrain the baseline image the fluxes are more uncertain and should be compared to spectroscopic measurements, where available.
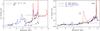 |
Fig. 4 Left: the mid-IR SED of the total integrated flux within the |

2.1.2. Spectroscopy
A low-resolution spectrum at N-band was obtained of the brightest peak M1 on June 16th, 2005. The slit with a width of 075 was centred on M1 and oriented along PA = − 10°. The spectral resolution is Rt185 − 390. Four spectral settings (λcentre = 8.8, 9.8, 11.4, and 12.4 μm), overlapping by at least by 15%, were used to cover the full N-band. The total on-source integration time was 30 min for each spectroscopic setting. Since the images show no large-scale diffuse emission, chopping and nodding on-slit were applied with a 12′′ chopper throw. The early-type A0 stars HIP 109268 and HIP 113963 were observed before and after each target observation for spectro-photometric flux calibration.
We reduced the data with the VISIR pipeline, which includes subtracting the chopped/nodded pairs, correcting for optical distortion, wavelength calibration and extracting the spectra from a 127 aperture in the spatial direction. Absolute flux calibration was obtained by integrating the standard star spectra over the VISIR filter bands and normalising their fluxes to the ones of the photometric standards. The accuracy of the flux calibration is approximately 20%. The resulting spectrum is shown in Fig. 4.
2.2. SINFONI
2.2.1. Data analysis
Observations of NGC 7552 were also taken with the Spectrograph for INtegral Field Observations in the Near Infrared (SINFONI) at the VLT. SINFONI provides spatial and spectral data in the form of a data cube covering the J, H, and K bands. The SINFONI instrument is mounted at the Cassegrain focus of the VLT Unit Telescope 4, Yepun (e.g. Bonnet et al. 2004; Gillessen et al. 2005). The observations were made in the J, H, and K bands using a spatial resolution setting of 025 pixel-1, corresponding to a field of view of 8′′ × 8′′, and were obtained on August 27th, 2005 without adaptive optics correction. The average air mass at the time of observation was 1.23 and the DIMM seeing between 1′′ and 13. Each galaxy had an integration time of 300 seconds per band and a spectral resolution R of 2000, 3000, and 4000, for the J, H, and K bands respectively.
The reduction of the data was performed with the SINFONI pipeline (Modigliani et al. 2007), version 1.7.1. This included the removal of detector signatures (geometric distortions, bad pixels, pixel gain variations, etc.), the sky emission correction, the wavelength calibration and the image reconstruction from the image slices. Flux calibration and removal of the contamination from telluric lines was performed using observations of the standard star HIP 025007. In Figs. 3c,d we show the continuum subtracted Pa-β and Br-γ line maps and representative sections of the J and K spectra to indicate the signal-to-noise. Although the H band was included in our observations, it is suffering heavily from OH atmospheric line contamination and not relevant for the following analysis.
We have also constucted the K band continuum image from integrating the SINFONI spectra across the K band without including the emission from strong lines. The result is shown in Fig. 3b and discussed in Sect. 3.1.
Table 3 lists the derived Paβ and Br-γ line fluxes, and the equivalent widths (EWs) of Br-γ, averaged over circular apertures of 07 centred on each mid-IR peak. The integrated line fluxes within the 3′′–8′′ annulus are also given in Table 3. We emphasize that our measured Br-γ line flux of 6.55 × 10⁻²¹ W cm-2, integrated over the central region, is in excellent agreement with the corresponding values from previous studies by different authors: 6.5 × 10⁻²¹ W cm-2 (Moorwood & Oliva 1990), 6.4 × 10⁻²¹ W cm-2 (Forbes et al. 1994a), and 5.7 × 10⁻²¹ W cm-2 (Schinnerer et al. 1997).
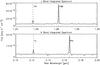 |
Fig. 5 Segments of the spatially integrated spectra at J (top) and K band (bottom) to illustrate the signal-to-noise. The strongest emission lines ([Fe ii], Pa-β, H2 and Br-γ are labelled. |
2.2.2. Uncertainties
We estimate the uncertainty in the measured Pa-β and Br-γ line fluxes to be 15% (Table 3). This uncertainty is a combination of the typically 10% absolute uncertainty on the SINFONI line fluxes – based on the residual slope in the standard star spectra after the division by the appropriate black body – and the systematic uncertainty in the peak position (estimated from shifting the extraction apertures by ± 1 spaxel).
The uncertainty of the EW of Br-γ is only 5% for two reasons. First, because an EW is a ratio of two measurements at similar wavelenths, the absolute photometric errors cancel out. Second, because the EW changes (with respect to the line flux) less rapidly with distance from the position of the IR peaks the EW is less sensitive to the positioning of the extraction aperture. The EW of Br-γ is mainly of importance for the derivation of the cluster ages. We note that all of the measurement uncertainties are small in comparison to the systematic errors given by the model assumptions (see Sects. 3.5 and 4.3).
2.3. Spitzer-IRAC
We have also analysed archival IRAC/Spitzer images of NGC 7552 from the SINGS Legacy Science Program (e.g. Dale et al. 2005). The images are shown in Fig. 6. Due to the smaller telescope aperture the angular resolution is much lower, approximately ~24. Nevertheless, two distinct, bright peaks in the ring are clearly visible. We have also performed aperture photometry using the standard IRAC 10 pixel (122) aperture radius with a sky annulus of 10–20 pixels. According to the IRAC Data Handbook (version 3.0) the photometric errors are dominated by the absolute calibration uncertainty of 10% resulting from the IRAC filter bandpass responses in sub-array mode (Quijada et al. 2004; Reach et al. 2005). The derived photometric fluxes are 198 mJy, 185 mJy, 624 mJy and 1809 mJy for IRAC bands 1 through 4, respectively. These flux densities are also indicated in Fig. 4.
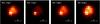 |
Fig. 6 Spitzer-IRAC images of NGC 7552 in the 3.6, 4.5, 5.8 and 8.0 μm bands. The plus signs indicate the positions of the VISIR MIR sources. |
2.4. Relative astrometry
Our analysis is based on multi-wavelength data, and the co-alignment and relative astrometry of the various maps is of utmost importance, as illustrated in Fig. 7. Our starting point is the radio map of Forbes et al. (1994b) with source B (radio nucleus, Table 2) as reference point. The absolute astrometry of the VISIR images was then derived from shifting the [Ne ii] image to best match the radio map. Next, we compared the morphology of the Br-γ emission (Fig. 3d) with the [Ne ii] map (Fig. 3a) and found an excellent agreement concerning the cluster peak positions. We then shifted the SINFONI maps by a small amount (within the VLT pointing uncertainties) to match the Br-γ and [Ne ii] maps.
The adjusted K band continuum image (Fig. 3b) shows the K band nucleus at RA =  , which is about
  to the south from the radio nucleus. We emphasize that the offset between apparent K-band nucleus and radio center (see also Fig. 3) is bootstrapped from the Br-γ image, which is part of the IFU data from which the K-band continuum was reconstructed.
The HST images shown in Fig. 7 were combined on the basis of the HST reconstructed pointing, and the [Ne ii]12.8 μm contours have been adjusted to the radio map (as described above) and then overplotted onto the HST coordinate frame. Like the K-band continuum, the HST images show the nucleus slightly offset to the south with respect to the active starburst ring. However, even if this offset would indicate the uncertainty in the absolute astrometric registration, the scientifically more relevant uncertainty here is the relative astrometry between emission peaks, which is approximately two VISIR pixels or  .
.
3. Analysis
3.1. Appearance of the ring at different wavelengths
As mentioned in the Introduction, the morphology of the inner region of NGC 7552 is quite complex. Based on imaging at BVI bands, Feinstein et al. (1990) found a nuclear region of low extinction within  in diameter, surrounded by a massive gas and dust ring, which is responsible for most of the far infrared flux. Subsequently, Forbes et al. (1994b) analysed 3 and 6 cm radio maps, combined with H-α images and found a starburst ring of diameter 9″ × 7″ (0.86 kpc × 0.67 kpc). For comparison, the sample of 22 nuclear rings of Mazzuca et al. (2008) shows diameters ranging from 0.4 kpc × 0.4 kpc to 3.4 kpc × 2.0 kpc. The ring in NGC 7552 looks almost circular in projection, due to its inclination of only ~28° (Feinstein et al. 1990), and has a width of 3″ − 4″. It contains about 60% of the 6 cm radio flux. Forbes et al. (1994b) state that this ring cannot be seen in single colour optical images largely because of dust extinction. High resolution NIR images taken with the SHARP 1 camera (Schinnerer et al. 1997) showed an inner ring-like structure with a diameter of
  , and similar structures have been seen at MIR wavelengths (Schinnerer et al. 1997; Siebenmorgen et al. 2004; van der Werf et al. 2006).
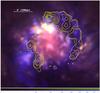 |
Fig. 7 Colour composite of the nuclear region of NGC 7552 made from archival HST/WFPC2 images in the F658N (H-α, blue) F336W (green), and F439W (red) filter. The yellow contours outline the [Ne ii]12.8 μm emission as detected with VISIR (Fig. 3a), the scale bar indicates 2′′ or 190 pc. North is up and east to the left. |
In order to assess the correspondence between the morphology seen in our MIR observations and other wavelengths at highest angular resolution, we have created a false colour image from archival HST/WFPC2 data in the F336W and F439W broadband filters and the H-α (F658N) narrowband filter. Figure 7 shows the central region, together with the contours of the VISIR [Ne ii] 12.8 μm emission. We find an excellent correspondence between the heavily dust extincted “dark ring” and the [Ne ii] emission. The HST images also confirm the early results of Feinstein et al. (1990) of a central ( ≤ ) region of low extinction surrounded by a massive ring of gas and dust. However we emphasize two findings:
-
First, the optically dark ring is the origin of most of theMIR emission (Fig. 3), and hence,the most recent population of massive stars in the center ofNGC 7552 is still hidden at opticalwavelengths. We also note that this happens on large scales ofhundreds of parsecs, not just locally for an individual cluster.Furthermore, the Br-γ map (Fig. 3d)resembles theMIR [Ne ii] map(Fig. 3a) very well.
-
Second, the reconstructed K band continuum map (Fig. 3b), which is very similar to the broadband image of Schinnerer et al. (1997, Fig. 2), does not resemble the Br-γ map at all, but looks smilar to the broadband optical colours seen by HST (Fig. 7). The northern K band continuum peaks (which must not be confused with the MIR peaks M1 and M3, which are at larger radii from the nucleus) coincide with the bright regions in the HST image. Most of the K band continuum emission comes from within the inner 3′′.
As far as the structure within the ring is concerned we also observe significant changes with wavelength. The IRAC images (Fig. 6) show two peaks, the northern one, which is close to our peaks M1 and M2, and the southern one, which coincides with the position of M7. The two peaks have similar brightness at 8 μm, while the southern one becomes the dominant peak at shorter wavelengths. Our strongest 12 μm source, M1, does not show significant emission in the K band continuum, whereas the nucleus appears as the brightest peak in the K band continuum image but is not detected at MIR wavelengths. A very interesting peak is M7 to the southeast, which is further discussed in Sect. 4.4.
3.2. SEDs of clusters and ring
Figure 4 displays the various mid-IR spectra and photometric measurements to construct the spectral energy distribution (SED) of the starburst ring of NGC 7552. Here we compare our VISIR measurements with the literature data from Spitzer (IRAC, IRS) and ISO (SWS, PHOT). The ISOPHOT spectrum (Siebenmorgen et al. 2004) was obtained through a 24′′ aperture, and the Spitzer-IRS spectrum from the SINGS Fifth Data Release (Kennicutt et al. 2003) integrated over a 27′′ × 43′′ wide spectral map. In addition, ISO-SWS observations (Verma et al. 2003,not shown in Fig. 4) revealed, within an aperture of 14′′ × 20′′, [Ar iii] and [S iv] line fluxes of 25 × 10-21 W cm-2 and 3 × 10-21 W cm-2, respectively.
Within the given uncertainties, the agreement between the measured fluxes from different instruments and observing modes is very good. This may be surprising since the ISO and Spitzer measurements also include the nucleus of NGC 7552 whereas the ground-based measurements focus on the ring only. However, the contribution of the nucleus to the total emission from the central region becomes increasingly less toward longer wavelengths (cf. Figs. 3b and 6) and is negligible at mid-IR wavelengths. Furthermore, the fact that the Spitzer-IRAC photometry agrees so well with the ISOPHOT measurements, and even the IRAS 12 μm flux density (Fig. 4), suggests that essentially all of the mid-IR emission comes from the central 12′′ region. For the total infrared luminosities of the individual clusters we refer to Sect. 4.2.
3.3. Clusters versus extended emission
Comparing the emission from the nine brightest mid-IR peaks to the total flux integrated over the ring, however, we find a significant mismatch. The large ratios between compact to total (compact plus diffuse) emission, quantified in Table 4, indicate that there must be substantial diffuse emission within the ring and outside the mid-IR peaks (ΣMi). The [Ne ii] and 12 μm continuum flux densities emitted by all identified clusters are only 32% and 25%, respectively, of the emission integrated over the ring area. The contribution of the clusters to the total emission in the 8.6 μm PAH band is even less, only 5%. Moreover, most of these 5% has its origin in the mid-IR source M7 (with less than 1% contribution from the most luminous peak M1). A substantial contribution of diffuse emission of [Ne ii] has also been observed in the dwarf starburst galaxy NGC 5253, where ~80% of the [Ne ii] line flux is diffuse and not directly associated with the central super star cluster (SSC) (Martín-Hernández et al. 2005; Beirão et al. 2006).
MIR emission from clusters versus total emission in the ring.
We emphasise that ground-based observations in the mid-IR generally possess a much reduced sensitivity to low surface brightness. Here we use the measured [Ne ii] line fluxes for comparison: Siebenmorgen et al. (2004) derived (490 ± 56) × 10-21 W cm-2 from TIMMI 2 observations, Verma et al. (2003) measured 680 × 10-21 W cm-2 from ISO-SWS data, and we derived (800 ± 50) × 10-21 W cm-2 for Spitzer-IRS from the 5th data release of the SINGS Legacy Team. While the [Ne ii] line fluxes from VISIR (Table 3) and TIMMI 2 agree reasonably well, the space-based measurements are typically about a factor of two higher. In other words, the ground-based measurements underestimate the emission from resolved low surface brightness regions. This technical shortcoming may be even more relevant for the derived PAH ratios. Hence, the above mentioned ratios from the first data column in Table 4 should only be considered an upper limit.
In summary, a large fraction of the [Ne ii] and PAH band emission is not directly associated with massive, young star clusters. In principle, the diffuse component may be due to an older population of stars (e.g., an aged generation of previous super star clusters), a more distributed mode of star formation (e.g., stars not localised in super star clusters), or a large fraction of radiation from the identified mid-IR peaks leaking out far into the surrounding interstellar medium. In any case, the localised emission diagnostics do not exclusively trace the most recent sites of star formation and need to be interpreted with care (see Sects. 4.1, 4.3).
3.4. PAH emission
The spectra in Fig. 4 are dominated by strong PAH emission features at 6.2, 7.7, 8.6, 11.3 and 12.7 μm. PAHs are considered the most efficient species for stochastic, photoelectric heating by UV photons in PDRs (Bakes & Tielens 1994). They are commonly found in star forming galaxies (e.g., Genzel & Cesarsky 2000; Smith et al. 2007). However, intense UV fields can also lead to the gradual destruction of PAH molecules (e.g., Geballe et al. 1989; Cesarsky et al. 1996; Beirão et al. 2006). PAHs may be considered as overall good tracers of starburst activity in a statistical sense (e.g. Brandl et al. 2006, and references therein).
The low-resolution VISIR N band spectrum of peak M1 obtained is shown in Fig. 4. It is characterised by a rising continuum, typical for thermal emission by dust, a strong [Ne ii] line, and a weak 11.3 μm PAH. We emphasise that the spectral flux density agrees very well with the photometric fluxes obtained through the VISIR filters, which agree well with the flux levels of the ISO and Spitzer spectra. Hence, we have good confidence in the absolute flux calibration of the VISIR spectra. Nevertheless, the weakness of the PAH emission feature in the spectrum is striking (see Sect. 4.1).
Using PAHs as quantitative tracers of star formation is known to have some shortcomings. First, at high angular resolution, the correspondence between observed PAH strength and the luminosity of the young clusters may break down, for reasons discussed in Sect. 4.1. Secondly, PAHs may also be excited in less UV-rich environments and can thus trace other sources besides massive young stars, such as planetary nebulae and reflection nebulae (e.g. Uchida et al. 1998; Li & Draine 2002), and B stars (Peeters et al. 2004). Since these sources dominate the galactic stellar budget, i.e. are also much more numerous in the volume that comprises the starburst ring in projection, we expect significant emission from these sources, in particular if the starburst has already been going on for while and we do not observe the first generation of super star clusters any more.
Table 5 lists the continuum subtracted PAH band fluxes for some mid-IR peaks and the integrated emission from the starburst ring. For comparison, measurements from TIMMI 2, ISOPHOT and Spitzer-IRS are also included.
Continuum subtracted 8.6 and 11.3 μm PAH band fluxes in units of 10-21 W cm-2.
3.5. Atomic hydrogen lines and stellar ages
The information provided by the atomic hydrogen lines listed in Table 3 can be used in various ways. The intensity of the extinction corrected Br-γ line (Sect. 3.6) can be used to calculate (see e.g., Ho et al. 1990) the number of hydrogen-ionising Lyman-continuum photons per second: 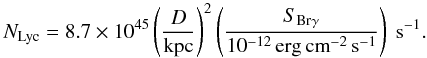 (1)From NLyc we can estimate an equivalent number of O7V stars (NO7V). We use the calibration of O star parameters provided by Martins et al. (2005, Table 4) for the observational Teff scale and a number of log (NO7V) = 48.75 Lyman continuum photons per O7V star. Both NLyc and NO7V are listed in Table 3.
The equivalent widths of the hydrogen recombination lines Hα and Br-γ are commonly used as age estimators of young stellar populations. These lines are predominantly produced by the most massive stars, which are short-lived. Hence, the strength of the line-to-continuum ratio is a strong function of cluster age as the most massive stars evolve.
The evolution of the Br-γ EW with time has been modelled in detail, e.g. by Leitherer et al. (1999,Starbust99). However, the relatively large distance to NGC 7552, the low EW of Br-γ, and the dense ISM in the starburst ring suggest that modelling the MIR peaks as isolated young clusters may be insufficient. We have therefore included another step based on the combination of Starburst99 with the photo-ionisation code Mappings (e.g. Dopita et al. 2000), which includes the radiation transfer in an evolving H ii-region. Groves et al. (2008a) have published a set of comprehensive, panchromatic starburst models, from where we took the equivalent width of Br-γ as a function of the cluster age. We assume an instantaneous star formation, a thermal pressure log (P/k) = 5, and a so-called compactness  . This compactness parameter describes the time evolution of the H ii-region, and is defined as
 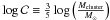 +
+  (see Groves et al. 2008a for details).
To derive the cluster ages we compared the extinction corrected EWs of Br-γ (Table 3) with the ages from the model. The resulting cluster ages are given in in the last column of Table 3.
A couple of items are noteworthy considering our age estimates. First, our approach is similar to the computed model tracks by Snijders et al. (2007, Fig. 14). Second, in comparison to “pure” Starburst99 estimates, we derive cluster ages that are systematically younger but only by 0.1–0.3 Myr. Third, the EW of Br-γ is only accurate for young ages. Beyond 6.5 Myr, EW(Br-γ) becomes very small, observational and model uncertainties begin to dominate, and for clusters older than 8 Myr Br-γ is even observed in absorption and may reduce the emission features of nearby, younger clusters. Finally, the relative differences among our derived cluster ages, however, can be considered quite accurate: the difference between a cluster age of 5.5 and 5.8 Myr corresponds to a difference in EWs of 18 Å and 8 Å, respectively, which is much larger than the spectrophotometric errors. We shy away from quantifying formal errors on the individual age estimates because we believe that the largest uncertainty may be given by the assumption that each photometric aperture includes only one, coeval stellar population.
3.6. Extinction
The N band includes the characteristic Si=O stretching resonance of silicate-based dust, centred at 9.7 μm. However, since it is usually surrounded by strong PAH emission features to both sides (see Fig. 4, left) its utilization as a quantitative measure of extinction in moderately dust enshrouded systems is very uncertain. On the other hand, the Br-γ/Paβ line ratio from the SINFONI IFU data allows us to create an extinction map by comparison with the case B theoretical ratio of 5.87 (assuming Te = 104 K and ne = 100 cm-3, Hummer & Storey 1987). Assuming a near-IR extinction law Aλ ∝ λ-1.8 (Martin & Whittet 1990) and RV = 3.1 (Mathis 1990) we calculated AV and list the values for the mid-IR peaks in Table 3. The average extinction of the nine peaks is AV = 7.4 and reaches from 5.2 to values as high as 9.0 for source M3. Integrated over the entire ring area, the average extinction reaches “only” AV = 5.3.
With this information we constructed an extinction map, pixel-by-pixel for the central region of NGC 7552, which is shown in Fig. 8. These spatially resolved maps can be used to correct the observed Br-γ line fluxes for extinction. The extinction corrected Br-γ line fluxes are listed in the third data column of Table 3. We note that there is, generally, a very good correspondence between the extinction peaks and our cluster positions.
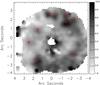 |
Fig. 8 Extinction map computed from the Pa-β and Br-γ line emission maps. The mid-IR peaks from Fig. 3a are indicated by red crosses. |
4. Results and discussion
Generally speaking, there are four main reasons why MIR images of starburst regions may reveal a different morphology than those taken at visible or near-IR wavelengths. All these effects should be kept in mind when discussing the properties of the “MIR clusters” to characterise the starburst ring.
The first one is simply angular resolution which is proportional to ∝ λ/D. Since the wavelength λ is typically 5–10 times longer and the telescope diameter D is often smaller, at least for space telescopes, the resulting angular resolution of the MIR images is much reduced. However, this effect does not play a role in this analysis – with the exception of the IRAC images presented in Fig. 6 – based on MIR images of  –
– resolution. The second one is simply the generally much lower sensitivity of ground-based MIR instruments. This effect will introduce a selection bias toward the most luminous clusters and overlook less luminous and older, more evolved clusters. The third one is dependency of the dust extinction on wavelength, which may reveal heavily embedded clusters at MIR wavelengths while they are invisible at shorter wavelengths. The fourth effect is the fundamental difference in the physical emission mechanism. While visible and NIR images mainly reveal the starlight of the cluster stars, the MIR emission is generally re-radiated light from the dust around the cluster. Fluctuations in the surrounding dust distribution may thus affect the location of the MIR peak, and substructures of smaller clusters, surrounded by dust lanes may appear as one large complex. In the following discussion we need to keep these issues in mind.
4.1. Resolving the H ii region structure
In the most simplistic picture, the massive stars in a young cluster provide a sufficient number of photons with Eγ ≥ 13.6 eV to ionise the surrounding hydrogen. The energetic radiation creates a so-called H ii region from where most of the emission from the ionic states with higher excitation potential originates: [Ne iii] (40.96 eV), [Ne ii] (21.56 eV), [S iv] (34.97 eV), [S iii] (23.34 eV), and [Ar iii] (27.63 eV). The H ii region is surrounded by molecular gas which is “only” exposed to far-UV radiation (6–13.6 eV), which strongly influences its chemical and thermal structure (Tielens & Hollenbach 1985), and which is responsible for most of the PAH emission. Beyond this photo-dissociation region (PDR) we expect the diffuse and partially neutral interstellar medium (ISM). In the most simplistic picture, the size of the H ii region is given by the Strömgren radius 
If we assume a density of 103 cm-3, a recombination coefficient βB = 2.6 × 10⁻¹³ cm3/s, and a Lyman continuum photon flux of NLyc = 5 × 1051 s-1 (Table 3) we get RS = 5.4 pc or a region of about 10.8 pc in diameter in projection.
In reality, however, the structure of giant PDR/H ii regions is significantly more complex as illustrated by the closer examples of 30 Doradus in the LMC (e.g., Indebetouw et al. 2009, Fig. 1) and NGC 604 in M 33 (e.g., Hunter et al. 1996, Figs. 2 and 3). The main differences between the Strömgren picture and these giant H ii regions are many-fold: they are not powered by a single, point-like cluster, but by several, distributed clusters; dust competes with the gas for ionising photons and will shrink the size of the H ii region; the radiation will not radiate perfectly isotropic and the interfaces between H ii region, and PDR are also shaped by the stellar winds, outflows and supernovae. Hence, the above estimated RS may only provide a rough estimate. In reality, the luminous PDRs are likely at larger distance from the centre of the H ii region. We would thus expect that spectra of the central cluster, taken at high angular resolution, will miss large contributions from the PDR.
At the given distance to NGC 7552 of 19.5 Mpc and a slit width of 075, the VISIR spectra cover a region of approximately 70 pc in size. Indeed, the discrepancy in the strength of the 11.3 μm PAH feature between the high resolution VISIR spectrum (black line in Fig. 4) and the spatially integrated (and rescaled) Spitzer spectrum (red line in Fig. 4) is striking. Similarly, the ratios in Table 4 are based on photometric aperture sizes of 65 pc. While, within the same aperture size, the clusters contain 32% of the [Ne ii] emission of the ring, they contain only 5% of the PAH emission. In other words, zooming in on radial distances of 33 pc around the clusters reduces the observed PAH strength by a factor of six. This is a clear indication that we are resolving the H ii/PDR complex.
This may not come as a big surprise. The strong dependency of mid-IR spectral diagnostics on the aperture size has already been pointed out by Martín-Hernández et al. (2006), and a similar effect was noted for the young super star clusters in the overlap region of the Antennae galaxies by Snijders et al. (2007); Brandl et al. (2009). However, we want to emphasise two findings: first, a significant fraction of the [Ne ii] emission escapes from the cluster regions. Second, at high angular resolution, the mid-IR spectra of the central clusters include only partial contributions from the PDR.
Both findings have important general implications: on one hand, the physical properties of the young stellar populations (such as age or initial mass function, IMF) derived from lines fluxes integrated over the entire galaxy are very uncertain, as a large fraction of the line flux may not be associated with those populations. On the other hand, comparing spectral features that originate from physically and spatially different regions (such as ionic lines from H ii regions and PAHs from PDRs) only for small apertures may lead to similar systematic errors.
4.2. Cluster luminosities and star formation rates
An important quantity to characterise starbursts is their bolometric luminosity. In very dusty environments (AV ≫ 1) we assume that the bolometric luminosity Lbol is approximately given by the total (8–1000 μm) infrared luminosity LIR. The latter is commonly derived (e.g., Sanders et al. 2003) from the four IRAS bands using the equation LIR = 562 860 × D2 × (13.48S12 μm + 5.16S25 μm + 2.58S60 μm + S100 μm), where Sλ is in Jy and D in Mpc. From the spatially integrated IRAS fluxes of NGC 7552 in we get LIR = 8.5 × 10¹⁰ L⊙. Considering only the starburst ring, Schinnerer et al. (1997) quote a bolometric luminosity of Lbol = 2.8 × 10¹⁰ L⊙.
Of particular interest are the infrared luminosities of the individual clusters. However, observations that cover the FIR regime do not possess the required spatial resolution, and the VISIR observations only cover 8–13 μm. Hence, we bootstrap the VISIR fluxe densities measured through the “NeII_2” filter (Table 1) to LIR estimates of clusters from the literature. The “NeII_2” filter has been chosen as the longest wavelength filter of our data set, which does not not include significant emission or absorption features. Brandl et al. (2009, Table 9) have provided SEDs and total infrared luminosities for six massive clusters in the Antennae galaxies. We have computed the ratios between the “NeII_2” filter band averaged F12 μm and LIR for these six clusters. Adjusted for the distance of NGC 7552 we get the empirical relation 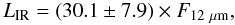 (2)where the 12 μm flux density is given in mJy and LIR in units of 106 L⊙. The quoted uncertainty is the standard deviation of the six derived ratios.
The estimated infrared luminosities are listed in Table 3. More than half of the total luminosity is provided by the clusters M1, M2 and M7. Summing up the total luminosity of all MIR peak yields  L⊙. This is 75% of the bolometric luminosity of the starburst ring derived by Schinnerer et al. (1997). The good agreement of these two estimates, derived by completely different methods, supports our “bootstrapping” approach.
Kennicutt (1998) has shown that the star formation rate (SFR) can be derived from LIR via: SFR [M⊙ yr-1] = 4.5 × 10-44 LIR [erg s-1]. We note that this conversion strictly applies only to the continuous star formation approximation with ages of order 10′100 Myr. Since our clusters are younger, the IR luminosity per unit mass of stars formed will be somewhat lower, and the Kennicutt (1998) relation will overestimate the true SFRs. (This limitation would also apply to the common method of directly estimating the SFR from the IRAS fluxes.) With the above conversion  L⊙ corresponds to a SFR of 3.7 M⊙ yr-1 within only the main clusters in the starburst ring. For comparison, Schinnerer et al. (1997) derived from the radio luminosity of the radio knots a star formation rate of 1 M⊙ yr-1 in the ring of NGC 7552, and Calzetti et al. (2010) derived from Spitzer photometry taken by the SINGS team 10.3 M⊙ yr-1 for the entire galaxy. The sample of 22 nuclear ring galaxies of Mazzuca et al. (2008) covered SFRs from 0.1 M⊙ yr-1 to 9.9 M⊙ yr-1, with a median value of 2.2 M⊙ yr-1. Our value of 3.7 M⊙ yr-1 fits very well within these numbers.
4.3. Cluster ages
The ages of clusters M1–M9 are listed in the last column of Table 3 and lie between 5.5 and 6.3 Myr with a mean age of 5.9 ± 0.3 Myr. Although they have been derived under the simplifying assumption of instantaneous star formation we can draw two important conclusions: First, there are no luminous young clusters associated with the mid-IR peaks that indicate very recent ( ≪ 5 Myr) star formation. Second, the age spread between the clusters associated with the mid-IR peaks is relatively small.
To investigate whether high extinction may hide the youngest clusters even at K band, we also use independent diagnostics at MIR wavelengths. A commonly used age diagnostic is the ratio of the two neon fine structure lines, [Ne iii] and [Ne ii], because it is largely independent of density and extinction effects. With excitation potentials of 40.96 eV and 21.56 eV, respectively, the ratio of [Ne iii] / [Ne ii] measures, to first degree, the hardness of the radiation field, which is mainly dominated by the massive O stars and thus a strong function of age and initial stellar mass function (IMF) of an instantaneous starburst. (We note that factors other than age may also play a role in affecting the observed line ratios, such as high metallicity (via stellar evolution and line blanketing), high electron density (Snijders et al. 2007), and variations of the upper IMF). Unfortunately, we have no measure of the [Ne iii]15.56 μm line, which lies outside the atmospheric transmission window, but we can still estimate the MIR fine structure line ratios in two different ways:
First, [Ne iii] has been measured from space. Both ISO-SWS and Spitzer-IRS found rather low [Ne iii] / [Ne ii] ≈ 0.08 through large apertures that covered the central region. The large discrepancy between compact and extended emission, as discussed in Sect. 3.3, complicates the interpretation of the line ratios. However, if we assume that most of the [Ne iii] is only produced by the massive O stars in the clusters – which is not an unrealistic assumption given the high excitation potential of [Ne iii] – we can compute the ratio between the [Ne iii] flux given by Thornley et al. (2000) and the sum of [Ne ii] from all clusters (Table 3). Under this assumption, we derive [Ne iii] / [Ne ii] ≈ 0.41. Starburst models (e.g. Snijders et al. 2007) indicate that a ratio of 0.4 is in good agreement with an age of approximately 5 Myr.
Second, for the brightest MIR peak M1 we obtained a VISIR spectrum that covers also the [S iv]10.51 μm line. Unfortunately, the [S iv] line was not detected in the VISIR spectrum of M1, so we need to follow a different route. [S iv] has an excitation potential of 34.97 eV, which is close to the 40.96 eV of [Ne iii], and may thus serve as a substitute. Groves et al. (2008b) provide an empirical calibration of [S iv] / [Ne ii] against [Ne iii] / [Ne ii], parametrised as: 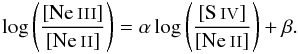 (3)From fits to a large sample of 97 extragalactic H ii regions and 56 starburst galaxies Groves et al. (2008b) derived the parameters α = 0.82 (0.65) and β = 0.36 (0.32) for extragalactic H ii regions (starburst galaxies). From the [Ne ii] flux listed in Table 3, the above correlation(s), and [Ne iii] / [Ne ii] ≈ 0.41, we would expect a [S iv] line flux from peak M1 of
  W cm-2 (
 W cm-2). In both cases, the line is too weak to be detected in our VISIR observations. Of course, this estimate assumes that the properties of M1 are similar to those of the other clusters in the starburst ring.
Independently, we can derive an upper limit on the [S iv] line flux from the noise in the 10.4–10.6 μm range. This yields a 3σ upper limit of  W cm-2. Hence, we derive an upper limit on the ratio of
  . Comparing this ratio with the models of Snijders et al. (2007,Fig. 9) yields a lower limit of 4 Myr on the age of peak M1, consistent with the Br-γ age estimate.
Data of selected luminous clusters from the literature for comparison.
4.4. The intriguing peak M7
A rather unusual and thus very interesting source is peak M7, located to the southeast of the center. A qualitative comparison between the three prominent peaks, M1, M7, and the nucleus, is given below, where “+” means bright and “–” means faint or undetected:
| Kcont | 8.6 μm PAH | [Ne ii] | |
|
|
|||
| Nucleus | + | – | – |
| M1 | – | – | + |
| M7 | + | + | + |
M7 is equally prominent in Br-γ, [Ne ii], and the K band continuum. What is most remarkable, however, is its strong 8.6 μm PAH emission. Figure 2 (center) shows that M7 is the brightest 8.6 μm PAH emitter in the center of NGC 7552. Furthermore, M7 is a peculiar source in two more regards.
First, the velocity field of the nuclear region (see Sect. 4.8), while overall relatively symmetric, reveals a distinct “nose” in the contour line of + 50 km s-1, approximately 3′′ to the southwest, where M7 is located. Apparently, the velocity field in the region of M7 is slightly disturbed.
Second, Rosenberg et al. (2012) have recently investigated the relationship between the [Fe ii]1.26 μm luminosity and the supernova rate in a sample of 11 nearby starburst galaxies, including NGC 7552. They derived the supernova rate from Starburst99 modelling of the Br-γ emission on a pixel-by-pixel basis and found a very good correlation across all 11 galaxies between the derived supernova rates and the measured [Fe ii] line luminosities – with one exception, namely M7 in NGC 7552. According to Rosenberg et al. (2012, their Fig. 7), the supernova rate derived from the Br-γ emission exceeds by far the corresponding [Fe ii] intensity.
We note that the derived age of M7, its dust extinction, Br-γ equivalent width, and total luminosity are well within the range of parameters of the other peaks (Table 3). Nevertheless, peak M7 is not likely a simple, single massive cluster (see Sect. 4.6 for a discussion of possible causes.)
4.5. Comparison with other massive clusters
The main question here is: are the MIR selected clusters in NGC 7552 in any way special, or similar to massive young clusters in other starburst galaxies? This can be best addressed by comparing the cluster properties in Table 3 with several “reference clusters” from the literature (Table 6).
While the globally integrated ratio of [Ne iii] / [Ne ii] ≈ 0.08 is significantly below the mean value of 20 starburst galaxies, the “corrected” value of 0.41 (Sect. 4.3) places NGC 7552 well within the range of starbursts and only a factor of two below the mean radiation hardness of Galactic H ii regions. The real outlier in this regard in Table 6 is NGC 3603, a very young Galactic H ii region, dominated by a single compact cluster, and NGC 5253. For the latter it was shown that the bulk of the high-excitation [S iv] and [Ne iii] fine structure line emission is also associated with the single compact cluster C2, whereas the diffuse component – showing [Ar ii], [S iii], and [Ne ii] emission – is much more extended (Martín-Hernández et al. 2005; Beirão et al. 2006). In terms of Lyman continuum photons NLyc, our peak M1 is only a factor three below the radio super-nebula NGC 5223 C2 (2 × 1052 s-1; Martín-Hernández et al. 2005). However, in terms of the ratio between ionising photons and the surrounding PDR mass, the peaks in NGC 7552 resemble the massive clusters in more luminous starburst galaxies, while NGC 3603 and NGC 5253 may be better compared to blue compact dwarf galaxies.
The total infrared luminosities of the peaks M1 through M9 are, on average, somewhat fainter than the most luminous Antennae cluster, but agree well with e.g., NGC 5223 C2, NGC 1365 M6 and NGC 4038/39 peak 5, which display similarly high extinction.
Since we have no good direct tracer of stellar mass (e.g. dynamical masses) we refrain from providing cluster mass estimates here. However, a comparison with the reference clusters of similar ages, LIR and NLyc in Table 6 suggests that our clusters have typical masses of a few million solar masses, which is not extraordinarily large. Significantly more massive young clusters, up to 3 × 10⁷ M⊙, have been found e.g. in NGC 1365 by Galliano et al. (2008).
The ages of the clusters in NGC 7552 are also well within the range of the MIR luminous clusters in Table 6. It is evident that most of the massive clusters listed here managed to retain a substantial amount of extinction after 5–7 Myr. An exception here is Arp 143. We note, however, that the starburst ring in Arp 143 results from a shock wave triggered by the recent head-on collision between the two galaxies, NGC 2444 and NGC 2445 (e.g., Beirão et al. 2009, and references therein). This scenario is physically different from dynamical instabilities in a quasi-stable nuclear region, and this difference will be reflected in the density of the ISM and its gas supplies (see also Sect. 4.7). In summary, we conclude that the clusters in the ring of NGC 7552 appear like typical unit cells of starbursts.
4.6. “Clusters” and “Peaks” may be misleading terms
So far we have, in a very simplistic way, equated a MIR “peak” with a super star cluster. Both species are closely related in starbursts, but there may not necessarily be a direct correspondence. In particular, one MIR peak may consist of several smaller clusters. We remind the reader that our angular resolution at near- and mid-IR wavelengths corresponds to about 30 pc, which is about one to two orders of magnitude larger than the typical core radius of a massive cluster (e.g., R136, Brandl et al. 1996). On one hand, it is likely that the hierarchical cloud fragmentation in a dense and turbulent ISM will lead to a conglomerate of smaller clusters (e.g., Bonnell et al. 2003). On the other hand, once a massive cluster has formed in a dense environment it may trigger the formation of other clusters in its vicinity (e.g., Deharveng et al. 2005). While both scenarios impact dynamical mass estimates and cluster evolution, the latter scenario has the most severe effect as the peak cannot be any longer considered a coeval population, formed in an instantaneous event.
Observationally, there is strong evidence for a more complex scenario. For instance, Bastian et al. (2009) found that the youngest clusters in the Antennae are not isolated but part of an extended hierarchy of star-forming regions. In those “nuclei” of star formation, one cluster is often surrounded by other clusters, which cannot be resolved with the current combination of telescopes and wavelengths. In the overlap region of the Antennae galaxies, Snijders et al. (2007) found on scales below the resolution limit a complex structure, which contains several young stellar clusters embedded in clumpy gas. Similarly, in a statistical analysis of Antennae clusters Mengel et al. (2005) found that the 10 Myr old clusters with high extinction are preferentially located near younger clusters. This suggests that in environments where the gas is not rapidly removed, ongoing – maybe even triggered – cluster formation is likely to happen.
These aspects are very relevant to the derived cluster properties as an unresolved complex of (sub-)clusters with significant age gradient will appear differently. While the high excitation lines (e.g. [Ne iii]) will be dominated by the young cluster, the lower excitation lines (e.g. [Ne ii]) will primarily originate in the older components, lowering the combined neon line ratio. In addition, the IMF – when normalised to the most luminous stars – will appear steeper (bottom heavy). Furthermore, dynamical mass estimates yield incorrect results since all components of the cluster complex will contribute to the diagnostic line but are not in virial equilibrium. And finally, significant patches of dust may be trapped in lanes between sub-clusters and remain associated with the observed peak for a longer time, as discussed in the next section.
4.7. Cluster evolution and extinction
Table 3 shows that the clusters of NGC 7552 have an average extinction of 7.4 mag (at an average age of 5.9 Myr). The large amount of gas and dust, still associated with our MIR peaks after relatively long time, indicates that the gas and dust dispersion has been rather inefficient during the first six million years. However, selecting clusters from MIR data introduces a selection bias toward the most heavily extincted clusters. This can be best illustrated for the Antennae galaxies:
The optically selected clusters within the Antennae have extinctions of ≤ 4 mag (with a mean of 2.6 mag in the age range 0–4 Myr (Whitmore & Zhang 2002). In a study of K band selected clusters in the Antennae (Mengel et al. 2005) found strongly variable extinction with an average value of AV = 1.3 mag. However, the MIR-selected clusters in the dusty overlap region of the Antennae have extinctions of AV > 4 up to AV ~ 10 mag (Brandl et al. 2009). Although the latter may not dominanate by numbers, they are no exotic species either: Whitmore et al. (2010) found that 16% ± 6% of the IR-bright clusters in the Antennae are still heavily obscured with values of AV > 3 mag. Mengel et al. (2005) found a clear trend of lower AV with increasing age. Several studies (e.g. Mengel et al. 2005; Whitmore et al. 2010) suggest that the typical time scale for massive clusters to emerge from their natal dust cocoons is less than 10 Myr.
However, the local environment and the location of the clusters within the galaxy is likely to play an important role in the efficiency of the dust removal. It is conceivable that the expansion of the H ii region goes faster in lower density environments (e.g., in dwarf galaxies or the outer spiral arms) than in higher density regions of galactic nuclei where the gas and dust are trapped in a potential and even get continuously replenished. Mengel et al. (2005) argue that an older cluster which suffers high extinction may no longer be directly surrounded and obscured by its own dust cocoon, but just happens to be located in a denser region of more recent star formation with higher dust content.
While this picture is likely to apply to clusters in starburst regions in general, and to clusters in the starburst ring of NGC 7552 in particular, we would like to reemphasize the “special” and distinct nature of MIR-selected “peaks”. Several studies (e.g., Whitmore & Zhang 2002; Whitmore et al. 2010) have found that, by number, the vast majority of hundreds of clusters in the Antennae is optically visible and can be well studied with the HST. On the other hand, the few highly reddened MIR peaks in the overlap region, although almost insignificant by number counts in comparison, account for approximately half of the total luminosity – and thus of the total star formation – of the Antennae (Brandl et al. 2009). It is likely that the latter species does not exist in galactic disks and can only be found in the densest environments. However, the study of clusters in starburst nuclei, ulta-luminous and sub-millimeter galaxies requires infrared observations at high angular resolution (cf. Fig. 7).
4.8. Star formation history in the ring
In the Introduction (Sect. 1) we have summarised the controversy around the physical origin and location of starburst rings. To complicate matters, the starburst ring does not appear to be an narrow ring with a series of young clusters lined up on a circle. Instead, we observe (e.g., Fig. 3) an annular region of ~200 pc width with increased and non-uniform star formation activity.
Here we take the existence of a ring for granted and want to investigate how and where the clusters form within that ring. We assume that the gas gets efficiently transported from the outer regions to the centre via the nuclear bar (Schwarz 1981; Ellison et al. 2011). The gas moves radially inward along the bar dust lanes and accumulates at the so-called contact points, the intersections between the dust lanes and the ring. These contact points are expected to be approximately perpendicular to the position angle of the bar major axis (Regan & Teuben 2003). Since the orientation of the major axis of the bar is roughly east-west while the contact points are to the north and south (Schinnerer et al. 1997), the observations support the theory. However, the details of where, how, and when the gas gets turned into stellar clusters are still uncertain and could possibly be explained with one of the following two scenarios.
In the first scenario, gas accumulates gradually in the nuclear region along the ring. Once a critical density is reached locally, the gas becomes unstable to gravitational collapse, and shocks may trigger the formation of a massive star cluster (Elmegreen 1994) or lead to further cloud fragmentation due to supersonic turbulence (e.g., Klessen 2001; Bonnell et al. 2003), resulting in an ensemble of clusters at that location. Since these instabilities occur randomly with respect to the galactic structure, no systematic age gradients or patterns within the ring would exist.
In the second scenario, most of the gas enters the ring at the intersection between the bar and the ring. Shocks play an important role here to get rid of the angular momentum, which is essential to move the gas into the central ring (see e.g., Mazzuca et al. 2008, and references therein). The pile-up of gas at these two contact points can be expected to ignite star formation in short-lived bursts. The clusters formed here will orbit along the ring, and age as they travel along the ring. In the meantime, new starburst events near the contact points may produce new generations of young star clusters. Hence, observationally, one would expect to find the youngest clusters of the ring near the contact points and increasingly older clusters in the direction of rotation.
Some evidence for the latter scenario was provided by Böker et al. (2008) for several galaxies, and in particular for NGC 613. In a more comprehensive study of 22 barred galaxies, Mazzuca et al. (2008) found that 10 out of 22 ring galaxies showed random variations in their H ii region properties with no apparent age gradient. However, 9 (out of 22) of their rings showed partial gradients along 25%–30% of their rings. Only three galaxies (NGC 1343, NGC 1530 and NGC 4321) showed a clear bipolar age gradient along the ring. Mazzuca et al. (2008) could not relate the presence or absence of age gradients with the morphology of the rings or their host galaxies.
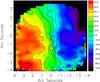 |
Fig. 9 Velocity field in [km s-1] of the nuclear region of NGC 7552 derived from the 2.166 μm Br-γ line shifts. |
In order to investigate a possible age gradient across the clusters in NGC 7552 we constructed a velocity map from the SINFONI Br-γ data (Fig. 9). The line offsets were converted into rotational velocities for a recessional velocity of NGC 7552 of (1640 ± 12) km s-1 (Mould et al. 2000, including “Virgo+GA+Shaply” ). With this velocity offset the kinematic centre position appears to lie close to the nucleus of NGC 7552 as traced by the K band continuum peak, and the velocity field appears rather symmetric to both sides of the centre. The zero velocity line of the Br-γ image is at the position angle of ~9° with the kinematic major axis at ~99°. The physical velocity of a ring element is then related to the observed, Doppler-shifted velocity via: 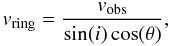 (4)where i is the inclination of 28° (Feinstein et al. 1990) and θ is the angle in the plane of the ring measured from the position angle. From Fig. 9 we derive a mean vring ≈ 150 km s-1, which is in perfect agreement with the typical rotation velocity of vrot = 150 km s-1Mazzuca et al. (2008) found for their sample of nuclear rings.
We can now estimate the travel time of a cluster at r = 275 pc along a quarter (90°) segment of the ring via: 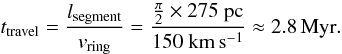 (5)Figure 10 shows a simplified representation of the scenario for NGC 7552 with both cluster locations and ages, and the travel timescales indicated. The youngest knots M1 and M4 appear indeed to be located at or near the northern contact point, and the oldest knots M6, M8 and M9 are located more than 90° away from the contact points. This signature provides evidence that the cluster age distribution is not completely random but somehow connected to the contact points of the ring. Our finding also agrees with the result of Mazzuca et al. (2008) that in two-thirds of their 22 barred galaxies the location of the youngest H ii region is within 20° of the contact points.
Despite the limited number of MIR peaks, we find some weak evidence for an age gradient in the direction of the ring rotation. However, the gradual age difference of the clusters is much smaller than the estimated cluster travel time. The presence of older clusters and the lack of very young clusters close to the contact points raise some doubts in this simple (second) scenario. Our observations clearly do not support the hypothesis that the high gas mass inflow rate will immediately trigger gravitational collapse and ignite massive cluster formation.
However, since the cluster ages are relatively large, they are likely to have travelled a significant distance from their birthplace to their observed location. It is intriguing that the age of peak M1, now located near the northern contact point, is exactly the travel time from the southern contact point to its current location (half a ring orbit). It appears therefore possible that a dramatic episode of gas inflow at the contact points about 5.6 Myr ago has triggered massive cluster formation at those locations. However, while this scenario would explain the location of at least some of the MIR peaks, it would also create a new problem: why should the gas inflow have stopped 5.6 Myr ago, at least to a level where no more massive young clusters are being formed? Since we have no additional evidence for such a scenario we don’t consider it very likely.
 |
Fig. 10 Schematic outline of the cluster age distribution with respect to the location of the contact points in NGC 7552. The green circles indicate the positions of the MIR peaks and the inscribed numbers their ages in million years. The direction and time scale of rotation are also indicated. |
In summary, the central cluster formation in NGC 7552 is not dominated by a simple bar/ring geometry, but it is not completely decoupled from the ring motion either. Either some negative feedback effects are at play (Dale et al. 2005) or the gas density will be built up more gradually over a larger ring segment, and the local physical conditions become dominant.
5. Summary
We have observed the starburst ring galaxy NGC 7552 with two instruments on ESO’s VLT, namely the Imager and Spectrograph for the mid-IR (VISIR) in both imaging and spectroscopy mode, and the Spectrograph for INtegral Field Observations in the Near Infrared (SINFONI) at the VLT. The angular resolution of the VISIR observations is 03–04, very close to the diffraction limit of VLT at 10 μm. We compared these data to ISO and Spitzer observations. Within the given uncertainties, the agreement between the measured fluxes from the different instruments and observing modes is very good. Our main findings can be summarized as follows:
-
The starburst ring is clearly identifiable at MIR wavelengths. The[Ne ii]12.8 μm lineemission correlates well with the NIR Br-γ emssion.
-
We find an excellent correspondence between the [Ne ii] emission regions and the highly dust extincted dark ring in optical HST observations. The latter look very similar to the K band continuum.
-
We have identified nine peaks of unresolved MIR emission. Our strongest 12 μm source does not show significant emission in the K band continuum.
-
We do not detect MIR emission from the nucleus of NGC 7552, which is very prominent at optical and NIR continuum wavelengths.
-
The multi-wavelength data indicate that the commonly used term “starburst ring” is insufficient to properly characterize a rather complex picture of cluster formation within an annular region of more than 100 parsec width.
-
A large fraction of the [Ne ii] and PAH band emission is not directly associated with the location of the massive, young star clusters. At the cluster positions we measured about 32% of the total [Ne ii] emission of the ring but only 5% of the PAH emission.
-
A comparison of the strength of the 11.3 μm PAH feature between VISIR and Spitzer spectra indicates that zooming in on the clusters on scales of 33 pc reduces the observed PAH strength by a factor of six. This can be explained by spatially resolving the H ii region from the PDR complex.
-
The individual cluster properties, in terms of infrared luminosities, ages, Lyman continuum photons, and extinction, are in good agreement with the properties of other MIR-selected massive clusters in other galaxies.
-
From the ratio of Br-γ/Paβ we computed an extinction map. The average extinction of the nine peaks is AV = 7.4 and reaches from 5.2 to 9.0. While the average extinction of our MIR-selected clusters is more than five times higher than that of K band selected clusters in the Antennae, it is similar to MIR-selected clusters in other dense starburst environments. Apparently, the mechanism of gas and dust removal is less efficent in these extreme environments.
-
The total luminosity of the nine MIR peak is LIR = 2.1 × 10¹⁰ L⊙, which is about 75% of the bolometric luminosity of the starburst ring. In the continuous star formation approximation this would correspond to a SFR of 3.7 M⊙ yr-1.
-
We determined the cluster ages from the equivalent width of the Br-γ line. They lie within the range of 5.9 ± 0.3 Myr. Independently, we estimated a ratio of [Ne iii] / [Ne ii] ≈ 0.41, which is in good agreement with an age of approximately 5 Myr.
-
The youngest massive clusters are located near the northern contact point of the ring while the oldeer peaks are observed further away from the contact points. However, the age spread among the clusters of 0.8 Myr is small compared to the travel time of ~ 5.6 Myr for half an orbit within the starburst ring. We cannot rule out that the clusters were formed near the contact points more than 5 Myr ago, but we find no strong evidence for the scenario where the continuous inflow of gas leads to the ongoing formation of massive clusters near the contact points. It appears more likely that the gas density build up more gradually over larger ring segments, and that the local physical conditions then determine the cluster formation.
-
Even at the resolution of VISIR on an eight-meter VLT, we cannot rule out that an unresolved MIR peak is not a single super star cluster but may consist of several sub-clusters, possibly with some age spread. If so, this would affect the derived ages, the slope of the IMF, and dynamical cluster mass estimates. This issue can only be solved with milli-arcsecond resolution at MIR wavelengths as will be provided by the next generation of extremely large telescopes (ELTs).
Throughout this paper we use the physical term “cluster” and the observable “MIR peak” as synonyms. Whether or not this is correct will be discussed in Sect. 4.6.
A seeing of 03 at 10 μm corresponds to 055 optical seeing. 03 is also the diffraction-limited resolution of an 8 m telescope at 10 μm.
Acknowledgments
We would like to thank Brent Groves for helpful discussions concerning the cluster age estimates, and Brad Whitmore for a discussion on the observational aspects of dust extinguished clusters. We would also like to thank the anonymous referee for spotting an error in the NIR data reduction in the draft version.
References
- Bakes, E. L. O., & Tielens, A. G. G. M. 1994, ApJ, 427, 822 [NASA ADS] [CrossRef] [Google Scholar]
- Bastian, N., Trancho, G., Konstantopoulos, I. S., & Miller, B. W. 2009, ApJ, 701, 607 [NASA ADS] [CrossRef] [Google Scholar]
- Beck, R. 2011 [arXiv:1112.1823] [Google Scholar]
- Beck, S. C., Turner, J. L., Langland-Shula, L. E., et al. 2002, AJ, 124, 2516 [NASA ADS] [CrossRef] [Google Scholar]
- Beirão, P., Brandl, B. R., Devost, D., et al. 2006, ApJ, 643, L1 [NASA ADS] [CrossRef] [Google Scholar]
- Beirão, P., Brandl, B. R., Appleton, P. N., Groves, B., et al. 2008, ApJ, 676, 304 [NASA ADS] [CrossRef] [Google Scholar]
- Beirão, P., Appleton, P. N., Brandl, B. R., et al. 2009, ApJ, 693, 1650 [NASA ADS] [CrossRef] [Google Scholar]
- Binney, J., & Tremaine, S. 2008, Galactic Dynamics, ed. J. Binney, & S. Tremaine, 2nd edn. (Princeton University Press) [Google Scholar]
- Böker, T., Falcón-Barroso, J., Schinnerer, E., Knapen, J. H., & Ryder, S. 2008, AJ, 135, 479 [NASA ADS] [CrossRef] [Google Scholar]
- Bonnell, I. A., Bate, M. R., & Vine, S. G. 2003, MNRAS, 343, 413 [NASA ADS] [CrossRef] [Google Scholar]
- Bonnet, H., Abuter, R., Baker, A., et al. 2004, The Messenger, 117, 17 [NASA ADS] [Google Scholar]
- Brandl, B., Sams, B. J., Bertoldi, F., et al. 1996, ApJ, 466, 254 [NASA ADS] [CrossRef] [Google Scholar]
- Brandl, B. R., Bernard-Salas, J., Spoon, H. W. W., et al. 2006, ApJ, 653, 1129 [NASA ADS] [CrossRef] [Google Scholar]
- Brandl, B. R., Snijders, L., den Brok, M., et al. 2009, ApJ, 699, 1982 [NASA ADS] [CrossRef] [Google Scholar]
- Buta, R., & Combes, F. 1996, Fund. Cosmic Phys., 17, 95 [Google Scholar]
- Calzetti, D., Wu, S.-Y., Hong, S., et al. 2010, ApJ, 714, 1256 [NASA ADS] [CrossRef] [Google Scholar]
- Cesarsky, D., Lequeux, J., Abergel, A., et al. 1996, A&A, 315, 309 [Google Scholar]
- Dale, J. E., Bonnell, I. A., Clarke, C. J., & Bate, M. R. 2005, MNRAS, 358, 291 [NASA ADS] [CrossRef] [MathSciNet] [Google Scholar]
- Dale, D. A., Gil de Paz, A., Gordon, K. D., et al. 2007, ApJ, 655, 863 [NASA ADS] [CrossRef] [Google Scholar]
- de Vaucouleurs, G., de Vaucouleurs, A., Corwin, Jr., H. G., et al. 1991, Third Reference Catalogue of Bright Galaxies (Berlin Heidelberg New York: Springer-Verlag), 1–3, 2069 [Google Scholar]
- Deharveng, L., Zavagno, A., & Caplan, J. 2005, A&A, 433, 565 [NASA ADS] [CrossRef] [EDP Sciences] [Google Scholar]
- Dopita, M. A., Kewley, L. J., Heisler, C. A., & Sutherland, R. S. 2000, ApJ, 542, 224 [NASA ADS] [CrossRef] [Google Scholar]
- Durret, F., & Bergeron, J. 1988, A&AS, 75, 273 [NASA ADS] [Google Scholar]
- Ellison, S. L., Nair, P., Patton, D. R., et al. 2011, MNRAS, 416, 2182 [NASA ADS] [CrossRef] [Google Scholar]
- Elmegreen, B. G. 1994, ApJ, 425, 73 [Google Scholar]
- Feinstein, C., Mendez, M., Vega, I., & Forte, J. C. 1990, A&A, 239, 90 [NASA ADS] [Google Scholar]
- Forbes, D. A., Kotilainen, J. K., & Moorwood, A. F. M. 1994a, ApJ, 433, L13 [NASA ADS] [CrossRef] [Google Scholar]
- Forbes, D. A., Norris, R. P., Williger, G. M., & Smith, R. C. 1994b, AJ, 107, 984 [NASA ADS] [CrossRef] [Google Scholar]
- Galliano, E., Alloin, D., Pantin, E., et al. 2008, A&A, 492, 3 [NASA ADS] [CrossRef] [EDP Sciences] [Google Scholar]
- Geballe, T. R., Tielens, A. G. G. M., Allamandola, L. J., Moorhouse, A., & Brand, P. W. J. L. 1989, ApJ, 341, 278 [NASA ADS] [CrossRef] [PubMed] [Google Scholar]
- Genzel, R., & Cesarsky, C. J. 2000, ARA&A, 38, 761 [NASA ADS] [CrossRef] [Google Scholar]
- Gil de Paz, A., Boissier, S., Madore, B. F., et al. 2007, ApJS, 173, 185 [NASA ADS] [CrossRef] [Google Scholar]
- Gillessen, S., Davies, R., Kissler-Patig, M., et al. 2005, The Messenger, 120, 26 [NASA ADS] [Google Scholar]
- Giveon, U., Sternberg, A., Lutz, D., Feuchtgruber, H., & Pauldrach, A. W. A. 2002, ApJ, 566, 880 [NASA ADS] [CrossRef] [Google Scholar]
- Gorjian, V., Turner, J. L., & Beck, S. C. 2001, ApJ, 554, L29 [NASA ADS] [CrossRef] [Google Scholar]
- Groves, B., Dopita, M. A., Sutherland, R. S., et al. 2008a, ApJS, 176, 438 [NASA ADS] [CrossRef] [Google Scholar]
- Groves, B., Nefs, B., & Brandl, B. 2008b, MNRAS, 391, L113 [NASA ADS] [Google Scholar]
- Ho, P. T. P., Beck, S. C., & Turner, J. L. 1990, ApJ, 349, 57 [NASA ADS] [CrossRef] [Google Scholar]
- Hummer, D. G., & Storey, P. J. 1987, MNRAS, 224, 801 [NASA ADS] [CrossRef] [Google Scholar]
- Hunter, D. A., Baum, W. A., O’Neil, E. J., & Lynds, R. 1996, ApJ, 456, 174 [NASA ADS] [CrossRef] [Google Scholar]
- Indebetouw, R., de Messières, G. E., Madden, S., et al. 2009, ApJ, 694, 84 [NASA ADS] [CrossRef] [Google Scholar]
- Kenney, J. D. P., Carlstrom, J. E., & Young, J. S. 1993, ApJ, 418, 687 [NASA ADS] [CrossRef] [Google Scholar]
- Kennicutt, Jr., R. C. 1998, in The Stellar Initial Mass Function (38th Herstmonceux Conference), ed. G. Gilmore, & D. Howell, ASP Conf. Ser., 142, 1 [Google Scholar]
- Kennicutt, Jr., R. C., Armus, L., Bendo, G., et al. 2003, PASP, 115, 928 [NASA ADS] [CrossRef] [Google Scholar]
- Klessen, R. S. 2001, ApJ, 556, 837 [Google Scholar]
- Knapen, J. H. 2005, A&A, 429, 141 [NASA ADS] [CrossRef] [EDP Sciences] [Google Scholar]
- Lagage, P. O., Pel, J. W., Authier, M., et al. 2004, The Messenger, 117, 12 [NASA ADS] [Google Scholar]
- Lebouteiller, V., Bernard-Salas, J., Brandl, B., et al. 2008, ApJ, 680, 398 [NASA ADS] [CrossRef] [Google Scholar]
- Leitherer, C., Schaerer, D., Goldader, J. D., et al. 1999, ApJS, 123, 3 [NASA ADS] [CrossRef] [Google Scholar]
- Li, A., & Draine, B. T. 2002, ApJ, 572, 232 [NASA ADS] [CrossRef] [Google Scholar]
- Liu, J.-F., & Bregman, J. N. 2005, ApJS, 157, 59 [NASA ADS] [CrossRef] [Google Scholar]
- Martin, P. G., & Whittet, D. C. B. 1990, ApJ, 357, 113 [NASA ADS] [CrossRef] [Google Scholar]
- Martín-Hernández, N. L., Schaerer, D., & Sauvage, M. 2005, A&A, 429, 449 [NASA ADS] [CrossRef] [EDP Sciences] [Google Scholar]
- Martín-Hernández, N. L., Schaerer, D., Peeters, E., Tielens, A. G. G. M., & Sauvage, M. 2006, A&A, 455, 853 [NASA ADS] [CrossRef] [EDP Sciences] [Google Scholar]
- Martins, F., Schaerer, D., & Hillier, D. J. 2005, A&A, 436, 1049 [NASA ADS] [CrossRef] [EDP Sciences] [Google Scholar]
- Mathis, J. S. 1990, ARA&A, 28, 37 [NASA ADS] [CrossRef] [Google Scholar]
- Mazzuca, L. M., Knapen, J. H., Veilleux, S., & Regan, M. W. 2008, ApJS, 174, 337 [NASA ADS] [CrossRef] [Google Scholar]
- Mengel, S., Lehnert, M. D., Thatte, N., & Genzel, R. 2005, A&A, 443, 41 [NASA ADS] [CrossRef] [EDP Sciences] [Google Scholar]
- Modigliani, A., Hummel, W., Abuter, R., et al. 2007 [arXiv:astro-ph/0701297] [Google Scholar]
- Moorwood, A. F. M., & Oliva, E. 1990, A&A, 239, 78 [NASA ADS] [Google Scholar]
- Mould, J. R., Huchra, J. P., Freedman, W. L., et al. 2000, ApJ, 529, 786 [NASA ADS] [CrossRef] [Google Scholar]
- Pantin, E., Lagage, P.-O., Claret, A., et al. 2005, The Messenger, 119, 25 [NASA ADS] [Google Scholar]
- Peeters, E., Spoon, H. W. W., & Tielens, A. G. G. M. 2004, ApJ, 613, 986 [NASA ADS] [CrossRef] [Google Scholar]
- Piner, B. G., Stone, J. M., & Teuben, P. J. 1995, ApJ, 449, 508 [NASA ADS] [CrossRef] [Google Scholar]
- Quijada, M. A., Marx, C. T., Arendt, R. G., & Moseley, S. H. 2004, in Optical, Infrared, and Millimeter Space Telescopes, ed. J. C. Mather, Proc. SPIE Conf. Ser., 5487, 244 [Google Scholar]
- Reach, W. T., Megeath, S. T., Cohen, M., et al. 2005, PASP, 117, 978 [NASA ADS] [CrossRef] [Google Scholar]
- Regan, M. W., & Teuben, P. 2003, ApJ, 582, 723 [NASA ADS] [CrossRef] [Google Scholar]
- Rosenberg, M. J. F., van der Werf, P. P., & Israel, F. P. 2012, A&A, 540, A116 [NASA ADS] [CrossRef] [EDP Sciences] [Google Scholar]
- Sandage, A., & Tammann, G. A. 1981, Carnegie Inst. of Washington, Publ., 635 [Google Scholar]
- Sanders, D. B., Mazzarella, J. M., Kim, D.-C., Surace, J. A., & Soifer, B. T. 2003, AJ, 126, 1607 [Google Scholar]
- Sarzi, M., Allard, E. L., Knapen, J. H., & Mazzuca, L. M. 2007, MNRAS, 380, 949 [NASA ADS] [CrossRef] [Google Scholar]
- Schinnerer, E., Eckart, A., Quirrenbach, A., et al. 1997, ApJ, 488, 174 [NASA ADS] [CrossRef] [Google Scholar]
- Schwarz, M. P. 1981, ApJ, 247, 77 [NASA ADS] [CrossRef] [Google Scholar]
- Sérsic, J. L., & Pastoriza, M. 1965, PASP, 77, 287 [NASA ADS] [CrossRef] [Google Scholar]
- Shlosman, I., Begelman, M. C., & Frank, J. 1990, Nature, 345, 679 [NASA ADS] [CrossRef] [Google Scholar]
- Siebenmorgen, R., Krügel, E., & Spoon, H. W. W. 2004, A&A, 414, 123 [NASA ADS] [CrossRef] [EDP Sciences] [Google Scholar]
- Smith, J. D. T., Draine, B. T., Dale, D. A., et al. 2007, ApJ, 656, 770 [NASA ADS] [CrossRef] [Google Scholar]
- Snijders, L., Kewley, L. J., & van der Werf, P. P. 2007, ApJ, 669, 269 [NASA ADS] [CrossRef] [Google Scholar]
- Telesco, C. M., Dressel, L. L., & Wolstencroft, R. D. 1993, ApJ, 414, 120 [NASA ADS] [CrossRef] [Google Scholar]
- Thornley, M. D., Schreiber, N. M. F., Lutz, D., et al. 2000, ApJ, 539, 641 [NASA ADS] [CrossRef] [Google Scholar]
- Tielens, A. G. G. M., & Hollenbach, D. 1985, ApJ, 291, 722 [NASA ADS] [CrossRef] [Google Scholar]
- Tully, R. B., & Fisher, J. R. 1988, Catalog of Nearby Galaxies, ed. R. B. Tully, & J. R. Fisher (Cambridge, UK: Cambridge University Press), 224 [Google Scholar]
- Uchida, K. I., Sellgren, K., & Werner, M. 1998, ApJ, 493, L109 [NASA ADS] [CrossRef] [Google Scholar]
- Vacca, W. D., Johnson, K. E., & Conti, P. S. 2002, AJ, 123, 772 [NASA ADS] [CrossRef] [Google Scholar]
- Väisänen, P., Rajpaul, V., Zijlstra, A. A., Reunanen, J., & Kotilainen, J. 2012, MNRAS, 420, 2209 [NASA ADS] [CrossRef] [Google Scholar]
- van der Werf, P. P., Snijders, L., Vermaas, L., Reunanen, J., & Hamelink, M. 2006, The Messenger, 126, 11 [NASA ADS] [Google Scholar]
- Verma, A., Lutz, D., Sturm, E., et al. 2003, A&A, 403, 829 [NASA ADS] [CrossRef] [EDP Sciences] [Google Scholar]
- Whitmore, B. C., & Zhang, Q. 2002, AJ, 124, 1418 [NASA ADS] [CrossRef] [Google Scholar]
- Whitmore, B. C., Chandar, R., Schweizer, F., et al. 2010, AJ, 140, 75 [NASA ADS] [CrossRef] [Google Scholar]
All Tables
Spectral properties and the measured flux densities in units of mJy through the nine used VISIR filters.
Absolute and relative coordinates of the MIR peaks with respect to the radio nucleus (Nuc) from Forbes et al. (1994b).
Physical properties of the clusters M1–M9 derived from 07 apertures centered on the mid-IR peaks.
All Figures
|
Fig. 1 Colour composite of NGC 7552 made from images provided by the SINGS team (Kennicutt et al. 2003) in H-α (blue), and the B and I bands (green and red, respectively), taken on the CTIO 1.5 m telescope. North is up and east to the left. A scale bar indicating angular and absolute distances is also shown. |
| In the text | |
|
Fig. 2 Left: continuum subtracted [Ne ii][12.8 μm] line image. Center: 8.6 μm PAH image Right: 12 μm continuum images taken in the SiC filter. The PAH image suffers from fixed pattern noise, but shows one bright peak, M7. All three images are displayed in linear intensity scaling; north is up and east is to the left. The bar indicates a scale of 2′′ or 190 pc. |
| In the text | |
|
Fig. 3 a) Upper left: VISIR image taken in the 12.8 μm filter. The 1 − σ RMS is approximately 0.57 mJy pixel-1. The plus signs indicate the locations of the MIR peaks M1 through M9, discussed in this paper. b) Upper right: K-band continuum image of NGC 7552, composed from the reconstructed SINFONI data cube. c) Lower left: reconstructed and continuum subtracted SINFONI Pa-β image. d) Lower right: reconstructed and continuum subtracted SINFONI Br-γ image. All four figures indicate the image scale in arcseconds (1″ corresponds to 95 pc) with respect to the radio continuum center (see Table 2 and Sect. 2.4). |
| In the text | |
|
Fig. 4 Left: the mid-IR SED of the total integrated flux within the |
| In the text | |
|
Fig. 5 Segments of the spatially integrated spectra at J (top) and K band (bottom) to illustrate the signal-to-noise. The strongest emission lines ([Fe ii], Pa-β, H2 and Br-γ are labelled. |
| In the text | |
|
Fig. 6 Spitzer-IRAC images of NGC 7552 in the 3.6, 4.5, 5.8 and 8.0 μm bands. The plus signs indicate the positions of the VISIR MIR sources. |
| In the text | |
|
Fig. 7 Colour composite of the nuclear region of NGC 7552 made from archival HST/WFPC2 images in the F658N (H-α, blue) F336W (green), and F439W (red) filter. The yellow contours outline the [Ne ii]12.8 μm emission as detected with VISIR (Fig. 3a), the scale bar indicates 2′′ or 190 pc. North is up and east to the left. |
| In the text | |
|
Fig. 8 Extinction map computed from the Pa-β and Br-γ line emission maps. The mid-IR peaks from Fig. 3a are indicated by red crosses. |
| In the text | |
|
Fig. 9 Velocity field in [km s-1] of the nuclear region of NGC 7552 derived from the 2.166 μm Br-γ line shifts. |
| In the text | |
|
Fig. 10 Schematic outline of the cluster age distribution with respect to the location of the contact points in NGC 7552. The green circles indicate the positions of the MIR peaks and the inscribed numbers their ages in million years. The direction and time scale of rotation are also indicated. |
| In the text | |
Current usage metrics show cumulative count of Article Views (full-text article views including HTML views, PDF and ePub downloads, according to the available data) and Abstracts Views on Vision4Press platform.
Data correspond to usage on the plateform after 2015. The current usage metrics is available 48-96 hours after online publication and is updated daily on week days.
Initial download of the metrics may take a while.