Fig. 4
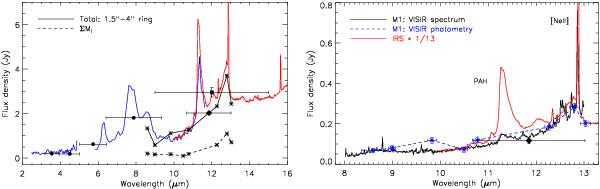
Left: the mid-IR SED of the total integrated flux within the  ring (black solid line) and the sum of our nine peaks ΣMi (black dashed line). The integrated flux of the entire galaxy as measured through the SiC filter (Table 1) is indicated by the diamond. The filled circles show the IRAC photometry using a 12
 2 aperture. The filled square is the 12 μm IRAS flux taken from Gil de Paz et al. (2007). The spectra from ISOPHOT (blue line) and Spitzer-IRS (red line) were taken through apertures of size 24′′ × 24′′ and 27′′ × 43′′, respectively. Right: the VISIR low-resolution N band spectrum of peak M1 (black line) in comparison to the Spitzer-IRS spectrum (red line). The latter covers the central 27′′ × 43′′ of NGC 7552 and was normalised to the former at 10 μm (scaled down by a factor of 13). In both spectra, the [Ne ii] fine-structure line at 12.8 μm is clearly present but the strength of the PAH 11.3 μm band differs significantly. In addition, the blue crosses indicate the VISIR narrowband photometry of M1 and the black diamond corresponds to the broadband SiC filter measurement.
Current usage metrics show cumulative count of Article Views (full-text article views including HTML views, PDF and ePub downloads, according to the available data) and Abstracts Views on Vision4Press platform.
Data correspond to usage on the plateform after 2015. The current usage metrics is available 48-96 hours after online publication and is updated daily on week days.
Initial download of the metrics may take a while.