Fig. 3
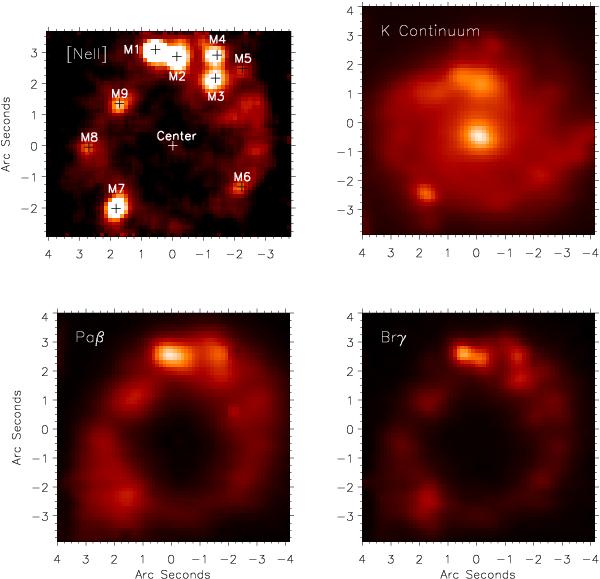
a) Upper left: VISIR image taken in the 12.8 μm filter. The 1 − σ RMS is approximately 0.57 mJy pixel-1. The plus signs indicate the locations of the MIR peaks M1 through M9, discussed in this paper. b) Upper right: K-band continuum image of NGC 7552, composed from the reconstructed SINFONI data cube. c) Lower left: reconstructed and continuum subtracted SINFONI Pa-β image. d) Lower right: reconstructed and continuum subtracted SINFONI Br-γ image. All four figures indicate the image scale in arcseconds (1″ corresponds to 95 pc) with respect to the radio continuum center (see Table 2 and Sect. 2.4).
Current usage metrics show cumulative count of Article Views (full-text article views including HTML views, PDF and ePub downloads, according to the available data) and Abstracts Views on Vision4Press platform.
Data correspond to usage on the plateform after 2015. The current usage metrics is available 48-96 hours after online publication and is updated daily on week days.
Initial download of the metrics may take a while.