| Issue |
A&A
Volume 543, July 2012
|
|
|---|---|---|
| Article Number | A10 | |
| Number of page(s) | 19 | |
| Section | Stellar structure and evolution | |
| DOI | https://doi.org/10.1051/0004-6361/201117436 | |
| Published online | 19 June 2012 | |
A double component in GRB 090618: a proto-black hole and a genuinely long gamma-ray burst
1 Dip. di Fisica and ICRA, Sapienza Università di Roma, Piazzale Aldo Moro 5, 00185 Rome, Italy
e-mail: This email address is being protected from spambots. You need JavaScript enabled to view it.
; This email address is being protected from spambots. You need JavaScript enabled to view it.
; This email address is being protected from spambots. You need JavaScript enabled to view it.
; This email address is being protected from spambots. You need JavaScript enabled to view it.
; This email address is being protected from spambots. You need JavaScript enabled to view it.
; This email address is being protected from spambots. You need JavaScript enabled to view it.
2 ICRANet, Piazza della Repubblica 10, 65122 Pescara, Italy
e-mail: This email address is being protected from spambots. You need JavaScript enabled to view it.
3 S. N. Bose National Center for Basic Sciences, Salt Lake, 700098 Kolkata, India
e-mail: This email address is being protected from spambots. You need JavaScript enabled to view it.
4 Indian Center for Space Physics, Garia, 700084 Kolkata, India
5 Universite de Nice Sophia Antipolis, CEDEX 2, Grand Chateau Parc Valrose, Nice, France
Received: 7 June 2011
Accepted: 3 April 2012
Abstract
Context. The joint X-ray and gamma-ray observations of GRB 090618 by very many satellites offer an unprecedented possibility of testing crucial aspects of theoretical models. In particular, they allow us to test (a) in the process of gravitational collapse, the formation of an optically thick e+e−-baryon plasma self-accelerating to Lorentz factors in the range 200 < Γ < 3000; (b) its transparency condition with the emission of a component of 1053−54 baryons in the TeV region and (c) the collision of these baryons with the circumburst medium (CBM) clouds, characterized by dimensions of 1015−16 cm. In addition, these observations offer the possibility of testing a new understanding of the thermal and power-law components in the early phase of this GRB.
Aims. We test the fireshell model of GRBs in one of the closest (z = 0.54) and most energetic (Eiso = 2.90 × 1053 erg) GRBs, namely GRB 090618. It was observed at ideal conditions by several satellites, namely Fermi, Swift, Konus-WIND, AGILE, RT-2, and Suzaku, as well as from on-ground optical observatories.
Methods. We analyzed the emission from GRB 090618 using several spectral models, with special attention to the thermal and power-law components. We determined the fundamental parameters of a canonical GRB within the context of the fireshell model, including the identification of the total energy of the e+e− plasma, Etote+e−, the proper GRB (P-GRB), the baryon load, the density and structure of the CBM.
Results. We find evidence of the existence of two different episodes in GRB 090618. The first episode lasts 50 s and is characterized by a spectrum consisting of a thermal component, which evolves between kT = 54 keV and kT = 12 keV, and a power law with an average index γ = 1.75 ± 0.04. The second episode, which lasts for ~100 s, behaves as a canonical long GRB with a Lorentz gamma factor at transparency of Γ = 495, a temperature at transparency of 29.22 keV and with a characteristic size of the surrounding clouds of Rcl ~ 1015−16 cm and masses of ~1022−24 g.
Conclusions. We support the recently proposed two-component nature of GRB 090618, namely, episode 1 and episode 2, with a specific theoretical analysis. We furthermore illustrate that episode 1 cannot be considered to be either a GRB or a part of a GRB event, but it appears to be related to the progenitor of the collapsing bare core, leading to the formation of the black hole, which we call a “proto-black hole”. Thus, for the first time, we are witnessing the process of formation of a black hole from the phases just preceding the gravitational collapse all the way up to the GRB emission.
Key words: gamma-ray burst: general / gamma-ray burst: individual: GRB 090618 / black hole physics
© ESO, 2012
1. Introduction
After the discovery of the gamma-ray bursts (GRBs) by the Vela satellites (Klebesadel et al. 1973; Strong & Klebesadel 1974; Strong et al. 1974; Strong 1975), the first systematic analysis on a large sample of GRBs was possible thanks to the observations of the BATSE instrument on board the Compton Gamma-Ray Observer (CGRO) satellite (Meegan et al. 1992). The 4BATSE catalog (Meegan 1997; Paciesas et al. 1999; Kaneko et al. 2006) consists of 2704 confirmed GRBs, and it is widely used by the science community as a reference for spectral and timing analyses on GRBs. One of the outcomes of this early analysis of GRBs led to the classification of GRBs as a function of their observed time duration. T90 was defined as the time interval over which the 90% of the total BATSE background-subtracted counts are observed. The distribution of the T90 duration was bi-modal: the GRBs with T90 less than 2 s were classified as “short” while those with T90 longer than 2 s were classified as “long” (Klebesadel 1992; Dezalay et al. 1992; Kouveliotou et al. 1993; Tavani 1998).
After the success of BATSE, a very many of space missions dedicated to GRB observations were launched. Particularly significant was the discovery of an additional prolonged soft X-ray emission by Beppo-SAX (Costa et al. 1997), following the usual hard X-ray emission observed by BATSE. The Beppo-SAX observed emission was named “afterglow”, while the BATSE one was called “prompt” radiation. The afterglow allowed pinpointing the GRB position in the sky more accurately and permitted identifying its optical counterpart by space- and ground-based telescopes. The measurement of the cosmological redshift for GRBs became possible and their cosmological nature was firmly established (van Paradijs et al. 1997).
The Beppo-SAX and related results enabled ruling out literally hundreds of theoretical models of GRBs (see for a review Ruffini 2001). Among the handful of surviving models was the one by Damour & Ruffini (1975), which is based on the mass-energy formula of black holes. This model can naturally explain the energetics up to 1054−55 erg, as requested by the cosmological nature of GRBs, through the creation of an e + e − -plasma by vacuum polarization processes in the Kerr-Newman geometry (for a recent review see Ruffini et al. 2010b). This model was proposed a few months after the presentation of the discovery of GRBs by Strong (Strong 1975) at the AAAS meeting in San Francisco.
It soon became clear that, as suggested by Goodman and Paczynski (Goodman 1986; Paczynski 1986), a Lorentz gamma factor larger than 100 could overcome the problem of opacity of the e + e − -plasma and justify the γ-ray emission of GRBs at cosmological distances (see e.g. Piran 2005). That the dynamics of an e + e − -plasma with a baryon load with mass MB would naturally lead to Lorentz gamma factor in the range (102–103) was demonstrated by Shemi & Piran (1990), Piran et al. (1993) and Meszaros et al. (1993). The general solution for a baryon load  between 0 and 10-2 was obtained in Ruffini et al. (2000). The interaction between the accelerated baryons with the CBM, indicated by Meszaros & Rees (1993), was advocated to explain the nature of the afterglow (see e.g. Piran 1999, and references therein).
The unprecedented existence of such large Lorentz gamma factors led to the relativistic space-time transformations paradigm for GRBs (Ruffini et al. 2001b). This paradigm made it a necessity to have a global, instead of a piecewise, description of the GRB phenomenon (Ruffini et al. 2001b). This global description led to the conclusion that the emission by the accelerated baryons interacting with the CBM indeed occurs already in the prompt emission phase in a fully radiative regime. A new interpretation of the burst structure paradigm was then introduced (Ruffini et al. 2001a): the existence of a characteristic emission at the transparency of an e + e − -plasma, the proper-GRB, followed by an extended-afterglow emission. The relative intensity of these two components is a function of the baryon load. It was proposed that B < 10-5 corresponds to the short GRBs, while B > 3 × 10⁻⁴ corresponds to the long GRBs.
This different parametrization of the prompt – afterglow versus that of the P-GRB – extended-afterglow could have originated years of academic discussions. However, a clear-cut observational evidence came from the Swift satellite, in favor of the second parametrization. The Norris-Bonnell sources, characterized by an initial short spike-like emission in the hard X-rays followed by a softer extended emission, had been indicated in the literature as short bursts. There is clear evidence that they belong to a new class of “disguised” short GRB (Bernardini et al. 2007; Caito et al. 2009, 2010; de Barros et al. 2011), where the initial spike is identified as the P-GRB while the prolonged soft emission occurring from the extended-afterglow emission in a CBM typically of the galatic halo. These sources have a baryon load 10-4 < B < 7 × 10⁻⁴: they are just long GRBs exploding in a particularly low-density CBM of the order of 10-3 particles/cm3. This class of sources has given the first evidence of GRBs originating from binary mergers, which is also strongly supported from direct optical observations (Bloom et al. 2006; Fong et al. 2010).
It is interesting that independent of the development of new missions, the BATSE data continue to attract full scientific interests, even after the end of the mission in the 2000. Important inferences, based on the BATSE data, on the spectra of the early emission of the GRB have been made by Ryde (2004) and Ryde et al. (2006). These authors have convincingly demonstrated that the spectral feature composed of a blackbody and a power-law plays an important role in selected episodes in the early part of the GRB emission (see also Zhang et al. 2011 for further comments on the origin of this blackbody and power-law behavior). They have also shown, in some cases, a power-law variation of the thermal component as a function of time, following a broken power-law behavior, see Fig. 17.
The arrival of the Fermi and other satellites allowed further progresses in the understanding of the GRB phenomenon in a much wider energy range. Thanks to the Gamma-Ray Burst Monitor (GBM) (Meegan et al. 2009) and the Large Area Telescope (LAT) (Atwood et al. 2009), additional data are obtained in the 8 keV–40 MeV and 100 MeV–300 GeV energy range. This allowed, among others, this first evidence of a GRB originating from the collapse of a core in the late evolution of a massive star, which we called the proto black hole (Ruffini 2011; Penacchioni et al. 2012).
In the specific case of GRB 090618, it has been possible to obtain a complete temporal coverage of the emission in gamma and X-rays, thanks to the joint observations by the Swift, Fermi, AGILE, RT-2/Coronas-PHOTON, Konus-WIND, and Suzaku-WAM telescopes. A full coverage in the optical bands, up to 100 days from the burst trigger, has been obtained. This has allowed determining the redshift, z = 0.54, of the source from spectroscopical identification of absorption lines (Cenko et al. 2009) and a recent claim of a possible supernova emission ~10 days after the GRB trigger. This GRB lasts for ~150 s in hard X-rays, and it is characterized by four prominent pulses. In the soft X-rays there are observations up to 30 days from the burst trigger.
We have pointed out in Ruffini et al. (2010a) that two different episodes are present in GRB 090618. We have also showed that while the second episode may fit a canonical GRB, the first episode is not expected to be either a part of a GRB or an independent GRB (Ruffini et al. 2011).
In the present paper we discuss the nature of these two episodes. In particular:
-
in Sect. 2, we describe the observations, datareduction and analysis. We obtain the Fermi GBM(8 keV–1 MeV and260 keV–40 MeV) flux lightcurves, shown in Fig. 2, following the standarddata reduction procedure, and make a detailed spectral analysis ofthe main emission features, using a Band model and a power-lawwith exponential high-energy cut-off spectral models;
-
in Sect. 3, after discussing about the most often quoted GRB model, the fireball, we recall the main features of the fireshell scenario, focusing on the reaching of transparency at the end of the initial optically thick phase, with the emission of the proper-GRB (P-GRB). In Fig. 3 we give the theoretical evolution of the Lorentz Γ factor as a function of the radius for selected values of the baryon load, corresponding to fixed values of the total energy
 . The identification of the P-GRB is crucial in determining the main fireshell parameters, which describe the canonical GRB emission. The P-GRB emission is indeed characterized by the temperature, the radius, and the Lorentz Γ factor at the transparency, which are related with the energy and the baryon load, see Fig. 4. We then recall the theoretical treatment, the simulation of the light curve and spectrum of the extended-afterglow and, in particular, the determination of the equations of motion, the role of the EQuiTemporal Surfaces (EQTS) (Bianco & Ruffini 2004, 2005a), as well as the ansatz of the spectral energy distribution in the fireshell comoving frame, (see Patricelli et al. 2011, and references therein). The temporal variability of a GRB light curve has been interpreted in some current models as caused by internal shock (Rees & Meszaros 1994). In the fireshell model this temporal variability is instead produced by the interaction of the ultra-relativistic baryons colliding with the inhomogeneities of the circumburst medium (CBM). This allows one to perform a tomography of the CBM medium around the location of the black hole formation, see Fig. 10, gaining important information on its structure. These collisions are described by three parameters: the nCBM average density, the filling factor ℛ, the clumpiness on scales of 1015−16 cm, and average density contrast 10-1 ≲ ⟨δn/n⟩ ≲ 10. We then refer also to the explanation of the observed hard-to-soft behavior due to the drop of the Lorentz Γ factor and the curvature effect of the EQTS. We then recall the determination of the instantaneous spectra and the simulations of the observed multi-band light curves in the chosen time interval, taking into account all the thousands of convolutions of comoving spectra over each EQTS leading to the observed spectrum. We also emphasize that these simulations have to be performed together and that they need to be optimized;
 -
in Sect. 4, we perform a spectral analysis of GRB 090618. We divided the total GRB emission into six time intervals, see Table 1, each one identifying a significant feature in the emission process, see also Rao et al. (2011). We considered two different spectral models in the data fitting procedure: a Band model (Band et al. 1993) and one by a blackbody plus a power-law component, following e.g. Ryde (2004). We find that the first 50 s of emission are well-fitted by both models, equally the following 9 s, from 50 to 59 s. The remaining part, from 59 to 151 s, is fitted satisfactorily only with the Band model, see Table 1;
-
in Sect. 5, we proceed to the analysis of GRB 090618 in the fireshell scenario; In Sect. 5.1, we attempt our first interpretation of GRB 090618 assuming it to be a single GRB. We recall that the blackbody is an expected feature in the theory of P-GRB. From the spectral analysis of the first 50 s, we find a spectral distribution consistent with a blackbody plus a power-law component. We first attempted a fit of the source identifying these first 50 s as the P-GRB, see Fig. 6. We confirm the conclusion reached in Ruffini et al. (2010a) that this interpretation is not sustainable for three different reasons, based on 1) the energetics of the source; 2) the time duration; and 3) the theoretical expected temperature for the P-GRB. We then proceed, in Sect. 5.2, to an interpretation of GRB 090618 as a multi-component system, following the procedure outlined in Ruffini et al. (2011), in which we outlined the possibility that the second episode between 50 and 151 s is an independent GRB. We identify the P-GRB of this second episode as the first 4 s of emission. We find that the spectrum in this initial emission can be fitted by a blackbody plus a power-law component, see Fig. 8. Since this extra power-law component can be generated by to the early onset of the extended afterglow, we took this into account to perform a fireshell simulation, which is shown in Fig. 8, with an energy
 erg and a baryon load B = 1.98 ± 0.15 × 10⁻³. In Figs. 10–12 we report the results of our simulations, summarized in Table 3. We notice, in particular, the presence of a strong time lag in this GRB. A detailed analysis, see Rao et al. (2011), of the time lags in the mean energy ranges of 35 keV, 68 keV and 125 keV, reports quite a long lag, ~7 s, in the first 50 s of the emission, which is unusual for GRBs, while in the following emission, from 51 to 151 s, the observed lags are quite normal, ~1 s;
 -
in Sect. 6, we perform a spectral analysis of the first 50 s, where we find a strong spectral variation with time, as reported in Table 5 and in Figs. 16, 17, with a chacteristic power-law time variation similar to those identified by Ryde & Pe’er (2009) in a sample of 49 BATSE GRBs;
-
in Sect. 7, we estimate the variability of the radius emitter, Fig. 18, and proceed to an estimate of the early expansion velocity. We interpret these data as originating in the expansion process occurring previous to the collapse of the core of a massive star to a black hole, see e.g. Arnett & Meakin (2011): these early 50 s of the emission are then defined as the proto-black hole phenomenon;
-
In Sect. 8 we conclude.
2. Observations
On 18 June 2009, the Burst Alert Telescope (BAT) on board the Swift satellite (Gehrels et al. 2009) observed GRB 090618 (Schady et al. 2009). After 120 s the X-Ray Telescope (XRT) (Burrows et al. 2005) and the UltraViolet Optical Telescope (UVOT) (Roming et al. 2005) on board the same satellite started the observations of the afterglow of GRB 090618. UVOT found a very bright optical counterpart, with a white filter magnitude of 14.27 ± 0.01 (Schady 2009) not corrected for the extinction, at the coordinates RA(J2000) = 19:35:58.69 = 293.99456, Dec(J2000) = +78:21:24.3 = 78.35676. The BAT light curve shows a multi-peak structure, whose total estimated duration is ~320 s, whose T90 duration in the (15–350) keV range was 113 s (Baumgartner et al. 2009). The first 50 s of the light curve present a smooth decay trend, followed by a spiky emission, with three prominent peaks at 62, 80, and 112 s after the trigger time, respectively, and each have the typical appearance of the FRED pulse (see e.g. Fishman et al. 1994), see Fig. 2. The time-integrated spectrum, (t0 − 4.4, t0 + 213.6) s in the (15−150) keV range, was found to agree with a power-law spectral model with an exponential cut-off, whose photon index was γ = 1.42 ± 0.08 and a cut-off energy Epeak = 134 ± 19 keV (Sakamoto et al. 2009). The XRT observations started 125 s after the BAT trigger time and lasted ~25.6 ks (Beardmore & Schady 2009) and reported an initially bright uncataloged source, identified as the afterglow of GRB 090618. Its early decay was very steep, ending at 310 s after the trigger time, when it starts a shallower phase, the plateau. Then the light curve breaks into a more steep last phase.
GRB 090618 was observed also by the Gamma-ray Burst Monitor (GBM) on board the Fermi satellite (Meegan et al. 2009). From a first analysis, the time-integrated spectrum, (t0, t0 + 140) s in the (8–1000) keV range, was fitted by a Band (Band et al. 1993) spectral model, with a peak energy Epeak = 155.5 keV, α = −1.26 and β = −2.50 (McBreen 2009), but with strong spectral variations within the considered time interval.
It is appropriate to compare and contrast the considerations of the time-integrated spectral analysis, often adopted in the current literature of GRBs, with the information from the time-resolved spectral analysis, as presented e.g. in this article (see also Zhang et al. 2011). For a traditional astrophysical source, steady during the observation time, the time-integrated and time-resolved spectral analysis usually coincide. In the case of GRBs, although the duration is only a few seconds, each instantaneous observation corresponds to a very different physical process and the two approaches have an extremely different physical and astrophysical content.
The redshift of the source is z = 0.54 and it was determined thanks to the identification of the MgII, Mg I, and FeII absorption lines, using the KAST spectrograph mounted at the 3-m Shane telescope at the Lick observatory (Cenko et al. 2009). Given the redshift and the distance of the source, we computed the emitted isotropic energy in the 8 − 10 000 keV energy range, with the Schaefer formula (Schaefer 2007): using the fluence in the (8–1000 keV) as observed by Fermi-GBM, Sobs = 2.7 × 10⁻⁴ (McBreen 2009), and the ΛCDM cosmological standard model H0 = 70 km s-1 Mpc-1, Ωm = 0.27, ΩΛ = 0.73, we obtain for the emitted isotropic energy the value of Eiso = 2.90 × 1053 erg.
This GRB was observed also by Konus-WIND (Golenetskii et al. 2009), Suzaku-WAM (Kono et al. 2009), and by the AGILE satellite (Longo et al. 2009), which detected emission in the (18–60) keV and in the MCAL instrument, operating at energies greater than 350 keV, but it did not observe high-energy photons above 30 MeV. GRB 090618 was the first GRB observed by the Indian payloads RT-2 on board the Russian Satellite CORONAS-PHOTON (Kotov et al. 2008; Nandi et al. 2009; Rao et al. 2011). Two detectors, namely, RT-2/S and RT-2/G, consist of NaI(Tl)/CsI(Na) scintillators in phoswich assembly viewed by a photomultiplier tube (PMT). RT-2/S has a viewing angle of 4° × 4° and covers an energy range of 15 keV to 1 MeV, whereas RT-2/G has an Al filter that sets the lower energy to ~20 keV. The mission was launched from Plesetsk Cosmodrom, Russia on 30 January 2009. During the event the RT-2 payload was in the SHADOW mode (away from the Sun) during 08:16:10.207 UT and ended at 08:37:35.465 UT and the GRB 090618 was detected at 77° off-axis angle. During this period, the spectrum was accumulated every 100 s, while the eight channel count rates for each detector were accumulated every second. The entire episode was observed for a duration of more than 200 s. A closer examination of the data in the accumulated channels 1:15–102 keV, 2:95–250 keV and 3:250–1000 keV indicates that the most significant counts is in channel 2 with a clear evidence of the following: (a) the emission in the first 50 s is prominent and broader in the lower channels, see Fig. 1 (b) after the first 50 s, there is evidence of a precursor of about 6 s duration before the main pulse (c) a break up into two peaks of the main pulse at intermediate energies (35–200 keV), while at higher energies (250–1000 keV) only the first peak of the main pulse survives, see Rao et al. (2011) and also Fig. 2 here.
Thanks to the complete data coverage of the optical afterglow of GRB 090618, the possible presence of a supernova underlying the emission of the GRB 090618 optical afterglow (Cano et al. 2011) was reported. The evidence of a supernova emission came from the presence of several bumps in the light curve and by the change in Rc − i color index over time: in the early phases, the blue color is dominant, typical of the GRB afterglow, but then the color index increases, suggesting a core-collapse SN. At late times, the contribution from the host galaxy was dominant.
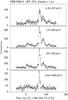 |
Fig. 1 RT2 light curves of GRB 090618. |
2.1. Data analysis
We considered the BAT and XRT data of the Swift satellite together with the Fermi-GBM and RT2 data of the Coronas-PHOTON satellite. The data reduction was made with the Heasoft v6.10 packages1 for BAT and XRT, and the Fermi-Science tools for GBM.
We obtained the BAT light curve and spectra using the standard headas procedure. After the data download from the gsfc website2, we made a detector quality map and corrected the event data for the known errors of the detector and the hot pixels. We subtracted the background from the data, corrected for the improved position, using the tool batmaskwtevt and obtained the 1-s binned light curves and spectra in the main BAT energy band 15–150 keV and its subranges, using the tool batbinevt. After the systematic corrections to the spectrum, we created the response matrices and obtained the final spectra.
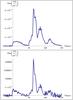 |
Fig. 2 Fermi-GBM flux light curve of GRB 090618 referring to the NaI (8–440 keV, upper panel) and BGO (260 keV–40 MeV, lower panel) detectors. |
For the XRT data, we obtained a total dataset using the standard pipeline, while for a time-resolved analysis we considered the on-line recipe, which is well described in literature, see Evans et al. (2007, 2009). The GBM data3, in particular the fourth NaI detector in the (8–440 keV) and the b0 BGO detector (260 keV–40 MeV), were analyzed using the gtbindef tool to obtain a GTI file for the energy distribution and the gtbin for the light curves and final spectra. To obtain an energy flux lightcurve, we made a time-resolved spectral analysis dividing the count lightcurve into six time intervals, each of them corresponding to a particular pulse, as described in the work of Rao et al. (2011). All time-resolved spectra were fitted using the XSPEC data analysis software (Arnaud 1996) version 12.6.0q, included in the Heasoft data package, and considering for each spectrum a classical Band spectral model (Band et al. 1993) and a power-law model with an exponential energy cut-off, folded through the detector response matrix. After subtracting the background, we fitted the spectrum by minimizing the χ2 between the spectral models described above and the observed data, obtaining the best-fit spectral parameters and the respective model normalization. In Table 1 we give the results of our spectral analysis. The time reported in the first column corresponds to the time after the GBM trigger time ttrig = 267 006 508 s, where the β parameter was not constrained, we used its averaged value, as delineated in Guetta et al. (2011)β = −2.3 ± 0.10. We considered the chi-square statistic for testing our data fitting procedure. The reduced chi-square  , where N is the number of degrees of freedom (d.o.f.), which is N = 82 for the NaI dataset and N = 121 for that of BGO.
For the last pulse of the second episode, the Band model is not very precise ( ), but a slightly better approximation is given by the power-law with an exponential cut-off, whose fit results are shown for the same intervals in the last two columns. From these values, we built the flux light curves for both detectors, which are shown in Fig. 2.
Time-resolved spectral analysis of GRB 090618.
We turn now to the XRT, which started to observe GRB 090618 ~ 120 s after the BAT trigger. Its early data show a continued activity of the prompt emission, fading away ~200 s after the BAT trigger time. Then the light curve is well approximated with a power-law decay. In view of the lack of soft X-ray data before the onset of the XRT, we cannot exclude a previous pulse in the X-ray light curve emission of GRB 090618. The following shallow and late decay phases, well-known in literature (Sari et al. 1999; Nousek et al. 2006), will not be analyzed in this paper since we focus on the first 200 s of the GRB emission.
3. A brief review of the fireshell and alternative models
3.1. The GRB prompt emission in the fireball scenario
A variety of models have been developed to theoretically explain the observational properties of GRBs. One of the most quoted is the fireball model (see for a review Piran 2005). The model was first proposed by Cavallo & Rees (1978), Goodman (1986) and Paczynski (1986), who have shown that the sudden release of a large quantity of energy in a compact region can lead to an optically thick photon-lepton plasma and to the production of e+e− pairs. The total annihilation of the e+e− plasma was assumed, leading to a vast release of energy pushing on the CBM: the “fireball”.
An alternative approach, originating in the gravitational collapse to a black hole, is the fireshell model (see for a review Ruffini et al. 2010b; Ruffini 2011). There the GRBs originate from an optically thick electron–positron plasma in thermal equilibrium, with a total energy of  . This plasma is initially confined between the radius of a black hole rh and the dyadosphere radius
 ![Mathematical equation: \begin{equation} \label{eq:rh} r_{\rm ds}= r_{\rm h} \left[2 \alpha \frac{E_{\rm tot}^{{\rm e}^+{\rm e}^-}}{m_{\rm e} c^2}\left(\frac{\hbar /m_{\rm e} c}{r_{\rm h}}\right)^3\right]^{1/4}, \end{equation}](/articles/aa/full_html/2012/07/aa17436-11/aa17436-11-eq110.png) (1)where α is the usual fine structure constant, ħ and c the Planck constant and the speed of light, and me the mass of the electron. The lower limit of coincides with Eiso. The condition of thermal equilibrium assumed in this model as shown by Aksenov et al. (2007), differentiates this approach from the alternative ones (e.g. the one by Cavallo & Rees 1978), see Sect. 3.2.
(1)where α is the usual fine structure constant, ħ and c the Planck constant and the speed of light, and me the mass of the electron. The lower limit of coincides with Eiso. The condition of thermal equilibrium assumed in this model as shown by Aksenov et al. (2007), differentiates this approach from the alternative ones (e.g. the one by Cavallo & Rees 1978), see Sect. 3.2.
In the fireball model, the prompt emission, including the sharp luminosity variations (Ramirez-Ruiz & Fenimore 2000) are caused by the prolonged and variable activity of the “inner engine” (Rees & Meszaros 1994; Piran 2005). The conversion of the fireball energy to radiation originates in shocks, either internal (when faster moving matter takes over a slower moving shell, Rees & Meszaros see 1994) or external (when the moving matter is slowed down by the external medium surrounding the burst, see Rees & Meszaros 1992). Much attention has been given to the synchrotron emission from relativistic electrons, possibly accompanied by SSC emission to explain the observed GRB spectrum. These processes were found to be consistent with the observational data of many GRBs (Tavani 1996; Frontera et al. 2000). However, several limitations have been reported in relation with the low-energy spectral slopes of time-integrated spectra (Crider et al. 1997; Preece et al. 2002; Ghirlanda et al. 2002, 2003; Daigne et al. 2009) and time-resolved spectra (Ghirlanda et al. 2003). Additional limitations on SSC have also been pointed out by Kumar & McMahon (2008a) and Piran et al. (2009).
The latest phases of the afterglow are described in the fireball model by assuming an equation of motion given by the Blandford-McKee self-similar power-law solution (Blandford & McKee 1976). The maximum Lorentz factor of the fireball is estimated from the temporal occurrence of the peak of the optical emission, which is identified with the peak of the forward external shock emission (Molinari et al. 2007; Rykoff et al. 2009) in the thin shell approximation (Sari & Piran 1999). Several partly alternative and/or complementary scenarios have been developed to the fireball model, e.g. based on quasi-thermal Comptonization (Ghisellini & Celotti 1999), Compton drag emission (Zdziarski et al. 1991; Shemi 1994), synchrotron emission from a decaying magnetic field (Pe’er & Zhang 2006), jitter radiation (Medvedev 2000), Compton scattering of synchrotron self-absorbed photons (Panaitescu & Mészáros 2000; Stern & Poutanen 2004), photospheric emission (Eichler & Levinson 2000; Mészáros & Rees 2000; Mészáros 2002; Daigne & Mochkovitch 2002; Giannios 2006; Ryde & Pe’er 2009; Lazzati & Begelman 2010). In particular, Ryde & Pe’er (2009) pointed out that the photospheric emission overcomes some of the difficulties of pure non-thermal emission models.
3.2. The fireshell scenario
In the fireshell model, the rate equation for the e + e − pairs and its dynamics have been given by Ruffini et al. (2000) (the pair-electromagnetic pulse or PEM pulse for short). This plasma engulfs the baryonic material left over in the process of gravitational collapse having mass MB, still keeping thermal equilibrium between electrons, positrons, and baryons. The baryon load is measured by the dimensionless parameter  . It was shown (Ruffini 1999) that no relativistic expansion of the plasma can be found for B > 10-2. The fireshell is still optically thick and self-accelerates to ultrarelativistic velocities (the pair-electromagnetic-baryonic pulse or PEMB pulse for short, Ruffini 1999). Then the fireshell becomes transparent and the proper – GRB (P-GRB) is emitted (Ruffini et al. 2001a). The final Lorentz gamma factor at transparency can vary in a vast range between 102 and 103 as a function of
  and B, see Fig. 3. For the final determination it is necessary to explicitly integrate the rate equation of the e + e − annihilation process and evaluate, for a given black hole mass and a given e + e − plasma radius, the reaching of the transparency condition, Ruffini et al. (2000), see Fig. 4.
The fireshell scenario does not require any prolonged activity of the inner engine. After transparency, the remaining accelerated baryonic matter still expands ballistically and starts to slow down by the collisions with the CBM, having average density ncbm. In the standard fireball scenario (Meszaros 2006), the spiky light curve is assumed to be caused by internal shocks. In the fireshell model the entire extended-afterglow emission is assumed to originate from an expanding thin shell, which enforces energy and momentum conservation in the collision with the CBM. The condition of a fully radiative regime is assumed (Ruffini et al. 2001a). This, in turn, allows one to estimate the characteristic inhomogeneities of the CBM, as well as its average value.
It is appropriate to recall another difference between our treatment and those in the current literature. The complete analytic solution of the equations of motion of the baryonic shell has been developed (Bianco & Ruffini 2004, 2005b), while in the current literature usually the Blandford-McKee (Blandford & McKee 1976) self-similar solution has been uncritically adopted (e.g. Meszaros et al. 1993; Sari 1997, 1998; Waxman 1997; Rees & Meszaros 1998; Granot et al. 1999; Panaitescu & Meszaros 1998; Gruzinov & Waxman 1999; van Paradijs et al. 2000; Mészáros 2002). The analogies and differences between the two approaches have been explicitly pointed out in Bianco & Ruffini (2005a).
From this general approach, a canonical GRB bolometric light curve composed of two different parts is defined: the P-GRB and the extended afterglow. The relative energetics of these two components, the observed temporal separation between the corresponding peaks, is a function of the above three parameters , B, and the average value of the ncbm; the first two parameters are inherent to the accelerator characterizing the GRB, i.e., the optically thick phase, while the third one is inherent to the GRB surrounding environment, which gives rise to the extended-afterglow. Regarding the observational properties of this model of a relativistic expanding shell, a crucial concept has been the introduction of the EQTS. In this topic, also, our model differs from those in the literature for deriving the analytic expression of the EQTS from the analytic solutions of the equations of motion (Bianco & Ruffini 2005a).
We assumed  . This assumption is based on the very accurate information we have on the luminosity and the spectral properties of the source. In other GRBs, we have assumed
  to take into account the observational limitations, owing to detector thresholds, distance effects, and lack of data.
3.3. The emission of the P-GRB
The lower limit of is given by the observed isotropic energy emitted in the GRB, Eiso. The identification of the energy of the afterglow and of the P-GRB determines the baryon load B and, from these, it is possible to determine the value of the Lorentz Γ factor at transparency, the observed temperature as well as the temperature in the comoving frame and the laboratory radius at transparency, see Fig. 4. We can indeed determine from the spectral analysis of the P-GRB candidate the temperature kTobs and the energy emitted in the transparency EPGRB. The relation between these parameters cannot be expressed by an analytical formulation: they can be only obtained by a numerical integration of the entire fireshell equations of motion. In practice we need to perform a trial-and-error procedure to find the set of values that fits the observations.
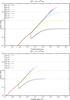 |
Fig. 3 Evolution of the Lorentz Γ factor until the transparency emission for a GRB of a fixed |
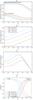 |
Fig. 4 Fireshell temperature in the comoving and observer frame and the laboratory radius at the transparency emission (panels a) and b)), the Lorentz Γ factor at the transparency (panel c)) and the energy radiated in the P-GRB and in the afterglow in units of |
As we will see in the case of GRB 090618, the direct measure of the temperature of the thermal component at the transparency offers a very important new information on the determination of the GRB parameters. In the emission of the P-GRB two different phases are present: one corresponding to the emission of the photons when the transparency is reached, and the second is the early interaction of the ultra-relativistic protons and electrons with the CBM. A spectral energy distribution with a thermal component and a non-thermal one should be expected to occur.
3.4. The extended afterglow
The majority of works in the current literature has addressed the analysis of the afterglow emission as due to various combinations of synchrotron and inverse Compton processes, see e.g. Piran (2005). It appears, however, that this description is not fully satisfactory (see e.g. Ghirlanda et al. 2003; Kumar & McMahon 2008b; Piran et al. 2009).
We adopted in the fireshell model a pragmatic approach by making full use of the knowledge of the equations of motion, of the EQTS formulations (Bianco & Ruffini 2005b) and of the correct relativistic transformations between the comoving frame of the fireshell and the observer frame. These equations, which relate the four time variables, are necessary for interpreting the GRB data. They are: a) the comoving time, b) the laboratory time, c) the arrival time, and d) the arrival time at the detector corrected for cosmological effects. This is the content of the relative space-time transformations paradigm, essential for the interpretation of GRBs data (Ruffini et al. 2001b). This paradigm required a global, instead of a piecewise, description of the GRB phenomenon (Ruffini et al. 2001b). This global description led to a new interpretation of the burst structure paradigm (Ruffini et al. 2001a). As recalled in the introduction, a new conclusion, arising from the burst structure paradigm, has been that the emission by the accelerated baryons interacting with the CBM is indeed occurring already in the prompt emission phase, just after the P-GRB emission. This is the extended-afterglow emission, which presents in its “light curve” a rising part, a peak, and a decaying tail. Following this paradigm, the prompt emission phase consists therefore of the P-GRB emission and the peak of the extended afterglow.
To evaluate the extended-afterglow spectral properties, we adopted an ansatz on the spectral properties of the emission in the collisions between the baryons and the CBM in the comoving frame. We then evaluated all observational properties in the observer frame by integrating on the EQTS. The initial ansatz of thermal spectrum (Ruffini et al. 2001a), has recently been modified to 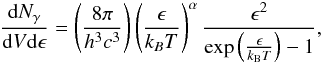 (2)where α is a phenomenological parameter defined in the comoving frame of the fireshell (Patricelli et al. 2011), determined by the optimization of the simulation of the observed data. It is well known that in the ultrarelativistic collision of protons and electrons with the CBM, collective processes of ultrarelativistic plasma physics are expected, which are not yet fully explored and understood (e.g. Weibel instability, Medvedev & Loeb see 1999). Promising results along this line have already been obtained by Spitkovsky (2008) and Medvedev & Spitkovsky (2009), and may lead to the understanding of the physycal origin of the α parameter in Eq. (2).
To take into due account the filamentary, clumpy and porous structure of the CBM, we introduced the additional parameter ℛ, which describes the fireshell surface filling factor. It is defined as the ratio between the effective emitting area of the fireshell Aeff and its total visible area Avis (Ruffini et al. 2002, 2005).
One of the main features of the GRB afterglow has been the observation of hard-to-soft spectral variation, which is generally absent in the first spike-like emission, which we have identified as the P-GRB, Bernardini et al. (2007); Caito et al. (2009, 2010); de Barros et al. (2011). An explanation of the hard-to-soft spectral variation has been advanced on the grounds of two different contributions: the curvature effect and the intrinsic spectral evolution. In particular, in the work of Peng et al. (2011) the authors used the model developed in Qin (2002) for the spectral lag analysis, taking into account an intrinsic Band model for the GRBs and a Gaussian profile for the GRB pulses to take into account the angular effects, and they found that both causes provide a very good explanation for the observed time lags. Within the fireshell model we can indeed explain a hard-to-soft spectral variation very naturally, in the extended-afterglow emission. Since the Lorentz Γ factor decreases with time, the observed effective temperature of the fireshell will drop as the emission goes on, consequently the peak of the emission will occur at lower energies. This effect is amplified by the curvature effect, which originates in the EQTS concept. Both these observed features are considered as responsible for the time lag observed in GRBs.
3.5. The simulation of a GRB light curve and spectra of the extended afterglow
The simulation of a GRB light curve and the respective spectrum also requires the determination of the filling factor ℛ and of the CBM density nCBM. These extra parameters are extrinsic and they are just functions of the radial coordinate from the source. The parameter ℛ, in particular, determines the effective temperature in the comoving frame and the corresponding peak energy of the spectrum, while ncbm determines the temporal behavior of the light curve. It is found that the CBM is typically formed of “clumps” of width ~ 1015 − 16 cm and average density contrast 10-1 ≲ ⟨δn/n⟩ ≲ 10 centered on the value of four particles/cm3, see Fig. 10, and clumps of masses Mclump ≈ 1022 − 24 g. Particularly important is the determination of the average value of ncbm. Values on the order of 0.1 − 10 particles/cm3 have been found for GRBs exploding inside star-forming region galaxies, while values on the order of 10-3 particles/cm3 have been found for GRBs exploding in galactic halos (Bernardini et al. 2007; Caito et al. 2009; de Barros et al. 2011). This clumpy medium, already predicted in pioneering works of Fermi in the theoretical study of interstellar matter in our galaxy (Fermi 1949, 1954), is by now well-established both from the GRB observations and by additional astrophysical observations, see e.g. the circum-burst medium observed in novae (Shara et al. 1997), or by theoretical considerations on supergiant, massive stars, clumpy wind (Ducci et al. 2009). Interesting are the considerations by Arnett and Meakin (Arnett & Meakin 2011), who have shown how realistic 2D simulations of the late evolution of a core collapse show processes of violent emission of clouds: there the 2D simulations differ from those in 1D, which show a much more regular and wind behavior around the collapsing core. Consequently, attention should be given also to instabilities prior to the latest phases of the evolution of the core, possibly giving rise to the cloud pattern observed in the CBM of GRB phenomenon (Arnett, priv. comm.).
The determination of the ℛ and nCBM parameters depends essentially on the reproduction of the shape of the extended-afterglow and of the respective spectral emission, in a fixed energy range. Clearly, the simulation of a source within the fireshell model is much more complex than simply fitting the N(E) spectrum with phenomenological analytic formulas for a finite temporal range of the data. It is a consistent picture, which has to find the best value for the parameters of the source, the P-GRB (Ruffini et al. 2001a), its spectrum, its temporal structure, as well as its energetics. For each spike in the light curve the parameters of the corresponding CBM clumps are computed, taking into account all the thousands of convolutions of comoving spectra over each EQTS that lead to the observed spectrum (Bianco & Ruffini 2005b,a). It is clear that, since the EQTS encompass emission processes occurring at different comoving times weighted by their Lorentz and Doppler factors, the “fitting” of a single spike is not only a function of the properties of the specific CBM clump but of the entire previous history of the source. Any mistake at any step of the simulation process affects the entire evolution that follows and, conversely, at any step a fit must be made consistently with the entire previous history: because of the non-linearity of the system and the EQTS, any change in the simulation produces observable effects up to a much later time. This leads to an extremely complex procedure by trial and error in the data simulation, in which the variation of the parameters defining the source are increasingly narrowed down, reaching the uniqueness very quickly. Of course, we cannot expect the latest parts of the simulation to be very accurate, since some of the basic hypothesis on the equations of motion, and possible fragmentation of the shell, can affect the procedure.
In particular, the theoretical photon number spectrum to be compared with the observational data is obtained by an averaging procedure of instantaneous spectra. In turn, each instantaneous spectrum is linked to the simulation of the observed multiband light curves in the chosen time interval. Therefore, the simulation of the spectrum and of the observed multiband light curves have to be performed together and have optimized simultaneously.
4. Spectral analysis of GRB 090618
We proceed now to the detailed spectral analysis of GRB 090618. We divide the emission in six time intervals, shown in Table 1, each one identifying a significant feature in the emission process. We then fit for each time interval the spectra by a Band model and a blackbody with an extra power-law component, following Ryde (2004). In particular, we are interested in estimating the temperature kT and the observed energy flux φobs of the blackbody component. The specific intensity of emission of a thermal spectrum at energy E in energy range dE into solid angle ΔΩ is 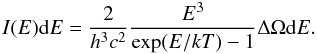 (3)The source of radius R is seen within a solid angle ΔΩ = πR2/D2, and its full luminosity is L = 4πR2σT4. What we are fitting, however, is the background-subtracted photon spectra A(E), which is obtained by dividing the specific intensity I(E) by the energy E:
 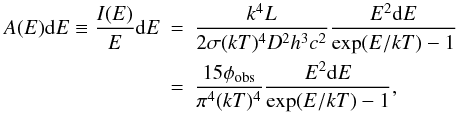 (4)where h, k and σ are the Planck, the Boltzmann, and the Stefan-Boltzmann constants respectively, c is the speed of light and φobs = L/(4πD2) is the observed energy flux of the blackbody emitter. The great advantage of Eq. (4) is that it is written in terms of the observables φobs and T, so from a spectral fitting procedure we can obtain the values of these quantities for each time interval considered. To determine these parameters, we must perform an integration of the actual photon spectrum A(E) over the instrumental response R(i,E) of the detector that observes the source, where i denotes the different instrument energy channels. The result is a predicted count spectrum
 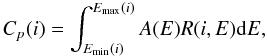 (5)where Emin(i) and Emax(i) are the boundaries of the ith energy channel of the instrument. Equation (5) must be compared with the observed data by a fit statistic.
The main parameters obtained from the fitting procedure are shown in Table 2. We divide the entire GRB in two main episodes, as advanced in Ruffini et al. (2011): one lasting the first 50 s and the other from 50 to 151 s after the GRB trigger time, see Fig. 5. Clearly, the first 50 s of emission, corresponding to the first episode, are well-fitted by a Band model as well as a blackbody with an extra power-law model, Fig. 6. The same happens for the first 9 s of the second episode (from 50 to 59 s after the trigger time), Fig. 7. For the subsequent three intervals corresponding to the main peaks in the light curve, the blackbody plus a power-law model does not provide a satisfactory fit. Only the Band model fits the spectrum with good accuracy, with the exception of the first main spike (compare the values of χ2 in the table). We find also that the last peak can be fitted by a simple power-law model with a photon index γ = 2.20 ± 0.03, better than by a Band model.
The result of this analysis points to a different emission mechanism in the first 50 s of GRB 090618 and in the following 9 s. A sequence of very strong pulses follows, whose spectral energy distribution is not attributable either to a blackbody or a blackbody and an extra power-law component. The evidence for the transition is well represented by the test of the data fitting, whose indicator is given by the changing of the  (Nd.o.f. = 169) for the blackbody plus a power-law model for the different time intervals, see Table 2. Although the Band spectral model is an empirical model without a clear physical origin, we checked its validity in all time-detailed spectra with the sole exception of the first main pulse of the second episode. The χ2 corresponding to the Band model for this main pulse, although better than that corresponding to the blackbody and power-law case, is unsatisfactory. We now directly apply the fireshell model to make the above conclusions more stringent and reach a better understanding of the source.
Time-resolved spectral analysis (8 keV–10 MeV) of the second episode in GRB 090618.
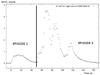 |
Fig. 5 Two episode nature of GRB 090618. |
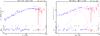 |
Fig. 6 Time-integrated spectra for the first episode (from 0 to 50 s) of GRB 090618 fitted with the Band, |
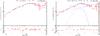 |
Fig. 7 Time-integrated spectra for the first 9 s of the second episode (from 50 to 59 s after the trigger time) of GRB 090618 fitted with the Band, |

5. Analysis of GRB 090618 in the fireshell scenario: from a single GRB to a multi-component GRB
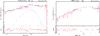 |
Fig. 8 Left panel, the time-integrated spectrum (8–440 keV) for the P-GRB emission episode (from 50 to 54 s after the trigger time) of GRB 090618 fitted with the blackbody + power-law models, |
5.1. Attempt for a single GRB scenario: the role of the first episode
We first approach the analysis of GRB 090618 by assuming that we observe a single GRB and attempt to identify its components in a canonical GRB scenario, based on the fireshell model. We first attempt the identification of the P-GRB emission. We have already seen that the integrated first 50 s can be well-fitted with a blackbody at a temperature kT = 32.07 ± 1.85 keV and an extra power-law component with the photon index γ = −1.75 ± 0.04, see panel A in Fig. 7 and Table 2. Because a blackbody component is the distinctive feature of the P-GRB, we first attempted an interpretation of GRB 090618 as a single GRB with the first 50 s as the P-GRB, Ruffini et al. (2010a). We first proceeded to evaluate if the energetics of the emission in the first 50 s can be interpreted as caused by a P-GRB. The energy emitted by the sole blackbody is  erg. Recalling that the isotropic energy of the entire GRB 090618 is Eiso = (2.90 ± 0.02) × 1053 erg, this means that the blackbody component would be ~2.9% of the total energy emitted in the burst. This would imply, see lower panel in Fig. 4, a baryon load B ~ 10-3 with a corresponding Lorentz Γ factor of ~800 and a temperature of ~52 keV. This value disagrees with the observed temperature kTobs = 32.07 keV.
One may attempt to reconcile the value of the theoretically predicted GRB temperature with the observed one by increasing . This would lead to an = 4 × 1054 erg and a corresponding baryon load of B ≈ 10-4. This would imply three major discrepancies: a) there would be an unjustified complementary unobserved energy; b) in view of the value of the baryon load, and the corresponding Lorentz Γ factor, the duration of the extended-afterglow emission would be more than an order of magnitude lower than the observed 100 s (Bianco et al. 2008); c) the duration of the first 50 s is much longer than the one typically expected for all P-GRBs identified in other GRBs (Ruffini et al. 2007), which is at maximum on the order of ~10 s. We have therefore considered this approach to be hopeless and proceeded to a different one looking for multiple components.
5.2. The multi-component scenario: the second episode as an independent GRB
5.2.1. The identification of the P-GRB of the second episode
We now proceed to the analysis of the data between 50 and 150 s after the trigger time as a canonical GRB in the fireshell scenario, namely the second episode, see Fig. 5 (Ruffini et al. 2011). We proceed to identify the P-GRB within the emission between 50 and 59 s, since we find a blackbody signature in this early second-episode emission. Considerations based on the time variability of the thermal component bring us to consider the first 4 s of this time interval as caused by the P-GRB emission. The corresponding spectrum (8–440 keV) is well fitted ( ) with a blackbody of a temperature kT = 29.22 ± 2.21 keV (norm = 3.51 ± 0.49), and an extra power-law component with photon index γ = 1.85 ± 0.06, (norm = 46.25 ± 10.21), see Fig. 8. The fit with the Band model is also acceptable (
 ). The fit gives a low-energy power-law index α = −1.22 ± 0.08, a high-energy index β = −2.32 ± 0.21 and a break energy E0 = 193.2 ± 50.8, see Fig. 8. In view of the theoretical understanding of the thermal component in the P-GRB, see Sect. 3.2, we focus below on the blackbody + power-law spectral model.
The isotropic energy of the second episode is Eiso = (2.49 ± 0.02) × 1053 ergs. The simulation within the fireshell scenario is made assuming  . From the upper panel in Fig. 4 and the observed temperature, we can then derive the corresponding value of the baryon load. The observed temperature of the blackbody component is kT = 29.22 ± 2.21, so that we can determine a value of the baryon load of B = 1.98 ± 0.15 × 10⁻³, and deduce the energy of the P-GRB as a fraction of the total . We therefore obtain a value of the P-GRB energy of 4.33
 × 1051 erg.
Now, from the second panel in Fig. 4 we can derive the radius of the transparency condition, to occur at rtr = 1.46 × 1014 cm. From the third panel we derive the bulk Lorentz factor of Γth = 495. We compare this value with the energy measured in the sole blackbody component of  erg, and with the energy in the blackbody plus the power-law component of
  erg, and verify that the theoretical value is in between these observed energies. We have found this result quite satisfactory: it represents the first attempt to relate the GRB properties to the details of the black hole responsible for the overall GRB energetics. The above theoretical estimates were based on a non rotating black hole of 10 M⊙, a total energy of
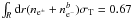
  erg and a mean temperature of the initial plasma of e + e − of 2.4 MeV, derived from the expression of the dyadosphere radius, Eq. (1). Any refinement of the direct comparison between theory and observations will have to address a variety of fundamental problems such as 1) the possible effect of rotation of the black hole, leading to a more complex dyadotorus structure; 2) a more detailed analysis of the transparency condition of the e + e − plasma, simply derived from the condition
  (Ruffini 1999); 3) an analysis of the general relativistic, electrodynamical, strong interactions descriptions of the gravitational collapse core leading to a black hole formation, (Cherubini et al. 2009; Ruffini et al. 2003; Ruffini 1999).
5.2.2. The analysis of the extended afterglow of the second episode
The extended afterglow starts at the above given radius of the transparency, with an initial value of the Lorentz Γ factor of Γ0 = 495. To simulate the extended-afterglow emission, we need to determine the radial distribution of the CBM around the burst site, which we assume for simplicity to be spherically symmetric, we infer a characteristic size of ΔR = 1015 − 16 cm. We already recalled how the simulation of the spectra and of the observed multi-band light curves have to be performed together and need to be jointly optimized, leading to the determination of the fundamental parameters characterizing the CBM medium (Ruffini et al. 2007). This radial distribution is shown in Fig. 10, and is characterized by a mean value of ⟨n⟩ = 0.6 part/cm3 and an average density contrast with a ⟨δn/n⟩ ≈ 2, see Fig. 10 and Table 4. The data up to 8.5 × 1016 cm are simulated with a value for the filling factor ℛ = 3 × 10⁻⁹, while the data from this value on with ℛ = 9 × 10⁻⁹. From the radial distribution of the CBM density, and considering the 1/Γ effect on the fireshell visible area, we found that the CBM clumps causing the spikes in the extended-afterglow emission have masses on the order of 1022 − 24 g. The value of the α parameter was found to be − 1.8 along the total duration of the GRB.
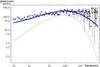 |
Fig. 9 Fireshell simulation, green line, and the sole blackbody emission, red line, of the time-integrated (t0 + 50, t0 + 54 s) spectrum of the P-GRB emission. The sum of the two components, the blue line, is the total simulated emission in the first 4 s of the second episode. |
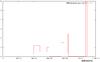 |
Fig. 10 Radial CBM density distribution for GRB 090618. The characteristic masses of each cloud are on the order of ~ 1022−24 g and 1016 cm in radii. |
In Fig. 11 we show the simulated light curve (8–1000 keV) of the GRB and the corresponding spectrum, using the spectral model described in Bianco & Ruffini (2004) and Patricelli et al. (2011).
We focus our attention on the structure of the first spikes. The comparison between the spectra of the first main spike (t0 + 59, t0 + 66 s) of the extended afterglow of GRB 090618, obtained with three different assumptions is shown in Fig. 12: in the upper panel we show the fireshell simulation of the integrated spectrum (t0 + 59, t0 + 66 s) of the first main spike, in the middle panel we show the best fit with a blackbody and a power-law component model and in the lower panel the best fit using a simple power-law spectral model.
Final results of the simulation of GRB 090618 in the fireshell scenario.
Physical properties of the three clouds surrounding the burst site.
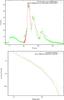 |
Fig. 11 Simulated light curve and time integrated (t0 + 58, t0 + 150 s) spectrum (8–440 keV) of the extended-afterglow of GRB 090618. |
We can see that the fit with the last two models is not satisfactory: the corresponding is 7 for the blackbody + power-law and ~15 for the simple power-law. We cannot give the of the fireshell simulation, since it is not represented by an explicit analytic fitting function, but it originates in a sequence of complex high non-linear procedure, summarized in Sect. 3. It is clear from a direct scrutiny that it correctly reproduces the low-energy emission, thanks in particular to the role of the α parameter, which was described previously. At higher energies, the theoretically predicted spectrum is affected by the cut-off induced by the thermal spectrum. The temporal variability of the first two spikes is well simulated.
We are not able to accurately reproduce the last spikes of the light curve, since the equations of motion of the accelerated baryons become very complicated after the first interactions of the fireshell with the CBM (Ruffini et al. 2007). This happens for different reasons. First, a possible fragmentation of the fireshell can occur (Ruffini et al. 2007). Moreover, at larger distances from the progenitor the fireshell visible area becomes larger than the transverse dimension of a typical blob of matter, consequently a modification of the code for a three-dimensional description of the interstellar medium will be needed. This is unlike the early phases in the prompt emission, which is the main topic we address at the moment, where a spherically symmetric approximation applies. The fireshell visible area is smaller than the typical size of the CBM clouds in the early phases of the prompt radiation (Izzo et al. 2010).
The second episode, lasting from 50 to 151 s, agrees with a canonical GRB in the fireshell scenario. Particularly relevant is the problematic of the P-GRB. It interfaces with the fundamental physics problems, related to the physics of the gravitational collapse and the black hole formation. There is an interface between the reaching of transparency of the P-GRB and the early part of the extended afterglow. This connection has already been introduced in the literature (Pe’er et al. 2012). We studied this interface in the fireshell by analyzing the thermal emission at the transparency with the early interaction of the baryons with the CBM matter, see Fig. 9.
We now aim to reach a better understanding of the meaning of the first episode, between 0 and 50 s of the GRB emission. To this end we examine the two episodes with respect to 1) the Amati relation; 2) the hardness variation; and 3) the observed time lag.
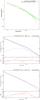 |
Fig. 12 Simulated time-integrated (t0 + 58, t0 + 66 s) count spectrum (8–440 keV) of the extended afterglow of GRB 090618 (upper panel), count spectrum (8 keV–10 MeV) of the main pulse emission (t0 + 58, t0 + 66), and best fit with a blackbody + power-law model (middle panel) and a simple power-law model (lower panel). |
6. The Amati relation, the HR, and the time lag of the two episodes
6.1. The first episode as an independent GRB?
We first checked if the two episodes separately fulfill the Amati relation, (Amati et al. 2002). By using the Band spectrum we verified that the first episode presents an intrinsic peak energy value of Ep,1st = 223.01 ± 24.15 keV, while the second episode presents an Ep,2nd = 224.57 ± 17.4 keV. The isotropic energies emitted in each single episode are Eiso,1st = 4.09 ± 0.07 × 1052 erg and Eiso,2nd = 2.49 ± 0.02 × 1053 erg, therefore both episodes satisfy the Amati relation, see Fig. 13. The fulfillment of the Amati relation of episode 2 was expected, because the second episode is a canonical GRB. What we find surprising is the fulfillment of the Amati relation of the first episode.
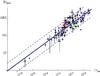 |
Fig. 13 Position of the first and second component of GRB 090618 in the Ep,i – Eiso plane with respect to the best fit of the Amati relation, as derived following the procedure described in Capozziello & Izzo (2010). The red circle corresponds to the first emission while the green circle corresponds to the second one. |
We first examine episode 1 as a single GRB. We notice a sharp rise in the luminosity in the first 6 s of emission. We therefore attempted a first interpretation by assuming the first 6 s to the P-GRB component of this independent GRB, and the remaining 44 s to be the extended-afterglow of this GRB. A value of the fit gives  erg and B = 1.5 × 10⁻⁴. This would imply a very high value for the Lorentz factor at the transparency of ~5000. In turn, this value would imply (Ruffini 1999) a spectrum of the P-GRB peaking around ~300 keV, which is in contrast with the observed temperature of 58 keV. Alternatively, we attempted a second simulation by assuming all observed data to be part of the extended afterglow of a GRB, with a P-GRB below the detector threshold. Assuming in this case
  , B = 10-2, and assuming for the P-GRB a duration shorter than 10 s, as confirmed from the observations of all existing P-GRBs (Ruffini et al. 2007), we should obtain an energy of the P-GRB greater than 10-8 erg/cm2/s, which should have been easily detectable from Fermi and Swift. This second possibility is therefore not viable either. We can then generally conclude that we cannot interpret this episode either as a P-GRB of the second episode, as proved in Sect. 3.2 or, as proved here, as a separate GRB. We then conclude that the fulfillment of the Amati relation does not imply that the source is necessarily a GRB.
6.2. The HR variation and the time lag of the two episodes
We finally address another difference between the two episodes, related to the hardness-ratio behavior (HR) and their observed time-lag. The first evidence of an evolution of the GRBs power-law slope indexes with time was observed in the BATSE GRB photon spectra (Crider et al. 1997). In the context of the fireshell scenario, as recalled earlier, the spectral evolution naturally develops from the evolution of the comoving temperature, the decrease of the bulk Lorentz Γ factor, and from the curvature effect (Bianco & Ruffini 2004), with theoretically predicted values, in excellent agreement with observations in past GRBs.
To build the HR ratio, we considered the data from three different instruments: Swift-BAT, Fermi-GBM and the CORONAS-PHOTON-RT-2. The plots obtained with these instruments confirm the existence of a peculiar trend of the hardness behavior: in the first 50 s it shows a monotonic hard-to-soft behavior, as expected because of the blackbody evolution of the first episode. For the second episode, the following 50 to 151 s of the emission, there is a soft-to-hard trend in the first 4 s of emission, and a hard-to-soft behavior modulated by the spiky emission in the following 100 s. For the HR ratio we considered the ratio of the count rate detected from a higher energy channel to that of a lower energy channel: HR = ctg(HE)/ctg(LE). In particular, we considered the count rate subtracted for the background, although this choice provides poor HR data in the time region dominated by the background, where the count rate can be zero or negative. For the Swift data, we considered the HR for two different energy subranges: the HR1 shows the ratio of the (50–150 keV) over the (15–50 keV) emission while the HR2 ratio shows the ratio of the (25–50 keV) over the (15–25 keV) emission, see Fig. 14.
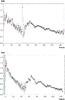 |
Fig. 14 Hardness-ratio ratios for the Swift BAT data in two different energy channels: HR1 = cts(25–50 keV)/cts(15–25 keV), HR2 = cts(50–150 keV)/cts(15–50 keV). |
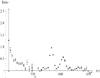 |
Fig. 15 Hardness-ratio for the Fermi data. We considered the cts observed in the (260 keV–40 MeV) energy range over the (8–260 keV) energy range. The time on the x-axis is reported in terms of the mission elapsed time (MET). Several negative data points arise because of noise, in other words the non-presence of GRB emission, in the background-subtracted BGO count light curve. |
A similar trend was found for the Fermi-GBM NaI and RT-2 instruments, see Fig. 15. In particular, the HR data from the Fermi observations were assembled the counts observed by the b0 BGO detector in the range (260 keV–40 MeV) and those observed by the n4 NaI detector in the range (8–260 keV). In Fig. 15 we show the HR for the Fermi observations, where we rebinned the counts in time intervals of 3 s. From this analysis we see that the HR peaks at the beginning of each pulse, also for the second-episode pulses, but each peak of the second-episode pulses is softer than the previous one, suggesting that these pulses are consequential in the second episode and generally agree with the advance of a fireshell in the CBM. Since RT-2 data clearly show both episodes up to 1 MeV, this complements the results obtained by Swift (up to 200 keV) and Fermi (up to 440 keV) in the high and the most interesting energy range. The hardness-ratio plot of (250–1000 keV)/(8–250 keV) indicates that the first phases of both episodes are the hardest.
Finally, the evident asymmetry of the first episode, supported by the observations of a long time lag in the high- and low-energy channels, see Fig. 2, suggests a different process at work. The first episode softens significantly, as reported in Rao et al. (2011), who observed a long time lag between the 15–25 keV energy range and 100–150 keV: the high-energy photons peak ~ 7 s before the photons detected in the 15–25 keV energy range. This long time lag is not observed in the second episode, where the lags are on the order of ~ 1 s.
Motivated by these results, we proceed to a most accurate time-resolved spectral analysis of the first episode to identify its physical and astrophysical origin.
7. A different emission process in the first episode
7.1. The time-resolved spectra and temperature variation
One of the most significant outcomes of the multi-year work of Felix Ryde and his collaborators, (see e.g. Ryde et al. 2010, and references therein), has been the identification and the detailed analysis of the thermal plus power-law features observed in time-limited intervals in selected BATSE GRBs. Similar features have also been observed in the data acquired by the Fermi satellite (Ryde et al. 2010; Guiriec et al. 2011). We propose to divide these observations into two broad families. The first family presents a thermal plus power-law(s) feature, with a temperature changing in time following a precise power-law behavior. The second family is also characterized by a thermal plus power-law component, but with the blackbody emission generally varying without a specific power-law behavior and on shorter time scales. It is our goal to study these features within the fireshell scenario to possibly identify the underlying physical processes. We have already showed in Sect. 4 that the emission of the thermal plus power-law component characterizes the P-GRB emission. We have also emphasized that the P-GRB emission is the most relativistic regime occurring in GRBs, uniquely linked to the process of the black hole formation, see Sect. 5. This process appears to belong to the second family considered above. Our aim here is to see if the first episode of GRB 090618 can lead to the identification of the first family of events: those whose temperature changes with time following a power-law behavior on time scales from 1 to 50 s. We have already pointed out in the previous section that the hardness-ratio evolution and the long time lag observed for the first episode (Rao et al. 2011) points to a distinct origin for the first 50 s of emission, corresponding to the first episode.
We made a detailed time-resolved analysis of the first episode, considering different time bin durations to obtain good statistics in the spectra and to take into account the sub-structures in the light curve. We then used two different spectral models to fit the observed data, a classical Band spectrum (Band et al. 1993), and a blackbody with a power-law component.
To obtain more accurate constraints on the spectral parameters, we made a joint fit considering the observations from both the n4 NaI and the b0 BGO detectors, covering a wider energy range in this way, from 8 keV to 40 MeV. To avoid some bias from low-photon statistics, we considered an energy upper limit of the value of 10 MeV. We report in the last three columns of Table 5 the spectral analysis performed in the energy range of the BATSE LAD instrument (20–1900 keV), as analyzed in Ryde & Pe’er (2009) as a comparison tool with the results described in that paper. Our analysis is summarized in Figs. 16, 17, and in Table 5, where we report the residual ratio diagram and the reduced-χ2 values for the spectral models.
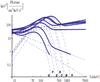 |
Fig. 16 Evolution of the BB+powerlaw spectral model in the ν F(ν) spectrum of the first emission of GRB 090618. It shows the cooling of the blackbody and of the associated non-thermal component with time. We only plot the fitting functions for clarity. |
Time-resolved spectral analysis of the first episode in GRB 090618.
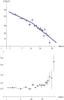 |
Fig. 17 Evolution of the kT observed temperature of the blackbody component and the corresponding evolution of the power-law photon index. The blue line in the upper panel corresponds to the fit of the time evolution of the temperature with a broken power-law function. It shows a break time tb around 11 s after the trigger time, as obtained from the fitting procedure. |
We conclude that both the Band and the proposed blackbody + power-law spectral models fit the observed data very well. Particularly interesting is the clear evolution in the time-resolved spectra, which corresponds to the blackbody and power-law component, see Fig. 16. The kT parameter of the blackbody, in particular, presents a strong decay, with a temporal behavior well-described by a double broken power-law function, see upper panel in Fig. 17. From a fitting procedure we obtain that the best fit (R2-statistic = 0.992) for the two decay indexes for the temperature variation are akT = −0.33 ± 0.07 and bkT = −0.57 ± 0.11. In Ryde & Pe’er (2009) an average value for these parameters on a set of 49 GRBs is given: ⟨akT⟩ = −0.07 ± 0.19 and ⟨bkT⟩ = −0.68 ± 0.24. We note, however, that in the sample considered in Ryde & Pe’er (2009) only few bursts shows a break time around 10 s, as in our case, see Fig. 17. Two of these bursts present many similarities with our source GRB 090618: GRB 930214 and GRB 990102. These bursts are characterized by a simple FRED pulse, whose total duration is ~40 s, quite close to the one corresponding to the first episode of GRB 090618. The break time tb in these two bursts are at 12.9 and 8.1 s respectively, while the decay indexes are akT = −0.25 ± 0.02 and bkT = −0.78 ± 0.04 for GRB 930214 and akT = −0.36 ± 0.03 and bkT = −0.64 ± 0.04 for GRB 990102, see Table 1 in Ryde & Pe’er (2009), which agrees very well with the values observed for the first episode of GRB 090618. We conclude that the values we observe in GRB 090618 are very close to the values of these two bursts. We return to compare and contrast our results with the other sources considered in Ryde & Pe’er (2009), and GRB 970828 (Pe’er et al. 2007) in a forthcoming publication.
The results presented in Figs. 16, 17, and Table 5, point to a rapid cooling of the thermal emission with time of the first episode. The evolution of the corresponding power-law spectral component also appears to be strictly related to the change of the temperature kT. The power-law γ index falls, or softens, with temperature, see Fig. 16. An interesting feature appears to occur at the transition of the two power-laws describing the observed decrease of the temperature. The long time lag observed in the first episode that we reported in Sect. 6.1 has a clear explanation in the power-law behavior of the temperature and corresponding evolution of the photon index γ, Figs. 16 and 17.
7.2. The radius of the emitting region
We turn now to estimate an additional crucial parameter for the identifying of the nature of the blackbody component: the radius of the emitter rem. We have proved that the first episode is not an independent GRB and not part of a GRB. We can therefore provide the estimate of the emitter radius from non-relativistic considerations, just corrected for the cosmological redshift z. We have, in fact, that the temperature of the emitter Tem = Tobs(1 + z), and that the luminosity of the emitter, due to the blackbody emission, is  (6)where rem is the emitter radius and σ is the Stefan-Boltzmann constant. From the luminosity distance definition, we also have that the observed flux φobs is given by
 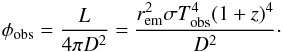 (7)We then obtain
 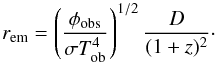 (8)The above radius differs from the radius rph given in Eq. (1) of Ryde & Pe’er (2009), which was also clearly obtained by interpreting the early evolution of GRB 970828 as belonging to the photospheric emission of a GRB and assuming a relativistic expansion with a Lorentz gamma factor Γ
 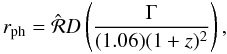 (9)where
 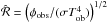 and the prefactor 1.06 arises from the dependence of rph on the angle of sight (Pe’er 2008). Typical values of rph are at least two orders of magnitude higher than our radius rem. We will return to the analysis of GRB 970828 in a forthcoming paper.
Assuming a standard cosmological model (H0 = 70 km s-1 Mpc-1, Ωm = 0.27 and ΩΛ = 0.73) for estimating the luminosity distance D, and using the values for the observed flux φobs and the temperature kTobs, we give in Fig. 18 the evolution of the surface radius that emits the blackbody rem as a function of time.
Assuming an exponential evolution with time tδ of the radius in the comoving frame, we obtain the value δ = 0.59 ± 0.11 from a fitting procedure, which is well compatible with δ = 0.5. We also notice a steeper behavior for the variation of the radius with time corresponding to the first 10 s, which corresponds to the emission before the break of the double power-law behavior of the temperature. We estimate an average velocity of  km s-1, R2 = 0.91, in these first 10 s of emission. In episode 1 the observations lead to a core of an initial radius of ~12 000 km expanding in the early phase with a higher initial velocity of ~4000 km s-1. The effective Lorentz Γ factor is very low, Γ − 1 ~ 10-5.
8. Conclusions
GRB 090618 is one of the closest (z = 0.54) and most energetic (Eiso = 2.9 × 1053 erg) GRBs up to date. It has been observed simultaneously by the largest number of X and γ ray telescopes: Fermi, Swift, AGILE, Konus-WIND, Suzaku-WAM, and the CORONAS-PHOTON-RT2. These circumstances have produced an unprecedented set of high-quality data as well as the coverage of the instantaneous spectral properties and of the time variability in luminosity of selected bandwidth of the source, see e.g. Figs. 1 and 2. In addition, there is also the possibility of identifying an underlying supernova event from the optical observations in the light curve of well-defined bumps, as well as from the corresponding change in color after about 10 days from the main event (Cano et al. 2011). Unfortunately, a spectroscopic confirmation of this supernova is lacking. We have restricted our attention in this paper to the sole X- and γ-ray emission of the GRB, without addressing the possible supernova component.
By applying our analysis within the fireshell scenario, see Sect. 4, we gained supporting evidence that GRB 090618 is indeed composed of two different episodes (Ruffini et al. 2010a): episode 1, lasting from 0 to 50 s, and episode 2 from 50 s to 151 s after the trigger time. We also illustrated the recent conclusions presented in Ruffini et al. (2011) that episode 1 cannot be a GRB or part of a GRB, see Sect. 5. With a time-resolved spectral analysis we fitted the instantaneous spectra with a blackbody plus an extra power-law component. The temperature of the blackbody appears to have a regular dependence with time, described by two power-law functions: a first power-law with decay index akT = −0.33 ± 0.07 and the second one with bkT = −0.57 ± 0.11, see Sect. 7. All these features precisely follow some of the results obtained by Felix Ryde and his collaborators (Ryde & Pe’er 2009), who analyzed selected temporal episodes in some GRBs observed by BATSE.
We also examined with particular attention, see Sect. 6, the radius rem of the blackbody emitter observed in the first episode, given by Eq. (8). We interpreted the nature of this episode 1 as originating from what we have defined as a proto-black hole (Ruffini et al. 2010a): the collapsing bare core leading to the black hole formation. Within this interpretation, the radius rem depends only on the observed energy flux of the blackbody component φobs, the temperature kT and on the luminosity distance of the source D. We obtained a radius of the emitting region that smoothly varies between ~12 000 and 70 000 km, see Fig. 18. Other interpretations associating the origin of this early emission to the GRB main event (Pe’er et al. 2007) lead to a different definition for the radius of the blackbody emitter, which results to be larger than our radius by at least two orders of magnitude. We are planning a systematic search for other systems that present these particular features.
Episode 2 is identified as a canonical long GRB that originates from the black hole formation process and lasts in arrival time from 50 s to 151 s after the trigger time. The good quality of the data allowed us to search for the P-GRB signature in the early emission of the episode 2. From a detailed analysis we find that the first 4 s of episode 2 agree well with the theoretically predicted P-GRB emission, see Sect. 5.2. The observed spectrum integrated over these 4 s is well-fitted by a blackbody with an extra power-law component, where this latter component is mainly due to the early emission of the extended-afterglow, see Fig. 8. From the temperature observed in the P-GRB, kTPGRB = 29.22 ± 2.21, and the energy of the second episode, which we assumed to be equal to the isotropic equivalent energy of this episode, = 2.49 × 1053 erg, we obtained the value of the baryon load of the GRB, see also Fig. 4, B = (1.98 ± 0.15) × 10-3, and a consequent Lorentz Γ factor at the transparency of Γ° = 495 ± 40. We were able to simulate the temporal and spectral emission of the second episode as seen by the Fermi-GBM instrument (8 keV–10 MeV). As we showed in Fig. 12, our simulation succeeds in fitting the light curves as well as the spectral energy distribution emitted in the first main spike of the second episode. The residual emission of the last spikes is reasonably well-fitted, taking into account the difficulties in integrating the equations of motion, which after the first interactions of the fireshell with the CBM become hardly predictable. The energetic of the simulation is fulfilled and we find that the emission is caused by blobs of matter in the CBM with typical dimensions of rbl = 1016 cm and average density contrast δn/n ≃ 2 particles/cm3 in an overall average density of 1 particle/cm3. We need to find additional cases of these phenomena to augment our statistics and improve our understanding of it.
Particularly relevant are the first two-dimensional hydrodynamical simulations of the progenitor evolution of a 23 M⊙ star close to core-collapse, leading to a naked core, as shown in the recent work of Arnett and Meakin (Arnett & Meakin 2011). In that work, pronounced asymmetries and strong dynamical interactions between burning shells are seen: the dynamical behavior proceeds to high amplitudes, enlarging deviations from the spherical symmetry in the burning shells. It is highly desirable to find a possible connection between the proto-black-hole concept, introduced in this work, with the Arnett and Meakin results: to compare the radius, the temperature, and the dynamics of the core we found in the present work with the naked core obtained by Arnett and Meakin from the thermonuclear evolution of the progenitor star. Particularly relevant are the strong waves during this phase of collapse, which originate in the mixing of the different elements’ shells. These waves should become able to compress, as they propagate inward, but they should also dissipate in non-convective regions, causing heating and slow mixing in these regions of the star. Since the wave heating is faster than radiative diffusion (which is very slow), an expansion phase of the boundary layers will occur, while the iron (Fe) core will contract (Arnett & Meakin 2011). There is also the interesting possibility that the CBM clouds observed in GRBs might be related to the vigorous dynamics in the violent activity of matter ejected in the evolution of the original massive star, well before the formation of the naked core (Arnett, priv. comm.).
It is appropriate to emphasize that these results have no relation with the study of precursors in GRBs performed in the current literature (see e.g. Burlon et al. 2008, and references therein). Episodes 1 and 2 are not temporally separated by a quiescent time. The spectral feature of episodes 1 and 2 are strikingly different and, moreover, episode 1 is very energetic, which is quite unusual for a typical precursor event. We finally conclude that for the first time we witness the process of formation of the black hole from the phases just preceding the gravitational collapse all the way up to the GRB emission.
There is now evidence that the proto black hole formation has been observed also in other GRB sources. After the submission of this article a second example has been found in GRB 101023, and a paper about this source was submitted on 4 November 2011 and was published on 1 February 2012 (Penacchioni et al. 2012). There, extremely novel considerations concerning the structure of the late phase of the emission in X-ray at times longer than 200 s have been presented which favor a standard signature in these sources (see also the considerations made in Page et al. 2011). The possible use of this new family of GRBs as distance indicators is being considered.
Acknowledgments
We thank David Arnett for most fruitful discussions, the participants of the Les Houches workshop “From Nuclei to White Dwarfs and Neutron Stars” held in April 2011 (ed. A. Mezzacappa & R. Ruffini, World Scientific 2011, in press), as well as the members of the AlbaNova University High Energy Astrophysics group. We are thankful to an anonymous referee for her/his important remarks both on the content and the presentation of our work, which have improved the presentation of our paper. L.I. is especially grateful to Marco Muccino for fruitful discussions about the work concerning this manuscript. We are also greateful to the Swift and Fermi teams for their assistance. One of us, A.V.P., acknowledges the support for the fellowship awarded for the Erasmus Mundus IRAP Ph.D. program. This work made use of data supplied by the UK Swift Science Data Centre at the University of Leicester.
References
- Aksenov, A. G., Ruffini, R., & Vereshchagin, G. V. 2007, Phys. Rev. Lett., 99, 125003 [Google Scholar]
- Amati, L., Frontera, F., Tavani, M., et al. 2002, A&A, 390, 81 [NASA ADS] [CrossRef] [EDP Sciences] [Google Scholar]
- Arnaud, K. A. 1996, in Astronomical Data Analysis Software and Systems V, ed. G. H. Jacoby, & J. Barnes, ASP Conf. Ser., 101, 17 [Google Scholar]
- Arnett, W. D., & Meakin, C. 2011, ApJ, 733, 78 [NASA ADS] [CrossRef] [Google Scholar]
- Atwood, W. B., Abdo, A. A., Ackermann, M., et al. 2009, ApJ, 697, 1071 [NASA ADS] [CrossRef] [Google Scholar]
- Band, D., Matteson, J., Ford, L., et al. 1993, ApJ, 413, 281 [NASA ADS] [CrossRef] [Google Scholar]
- Baumgartner, W. H., Barthelmy, S. D., Cummings, J. R., et al. 2009, GRB Coordinates Network, 9530, 1 [NASA ADS] [Google Scholar]
- Beardmore, A. P., & Schady, P. 2009, GRB Coordinates Network, 9528, 1 [NASA ADS] [Google Scholar]
- Bernardini, M. G., Bianco, C. L., Caito, L., et al. 2007, A&A, 474, L13 [NASA ADS] [CrossRef] [EDP Sciences] [Google Scholar]
- Bianco, C. L., & Ruffini, R. 2004, ApJ, 605, L1 [NASA ADS] [CrossRef] [Google Scholar]
- Bianco, C. L., & Ruffini, R. 2005a, ApJ, 633, L13 [NASA ADS] [CrossRef] [Google Scholar]
- Bianco, C. L., & Ruffini, R. 2005b, ApJ, 620, L23 [NASA ADS] [CrossRef] [Google Scholar]
- Bianco, C. L., Bernardini, M. G., Caito, L., et al. 2008, in AIP Conf. Ser. 1065, ed. Y.-F. Huang, Z.-G. Dai, & B. Zhang, 223 [Google Scholar]
- Blandford, R. D., & McKee, C. F. 1976, Phys. Fluids, 19, 1130 [NASA ADS] [CrossRef] [Google Scholar]
- Bloom, J. S., Prochaska, J. X., Pooley, D., et al. 2006, ApJ, 638, 354 [NASA ADS] [CrossRef] [Google Scholar]
- Burlon, D., Ghirlanda, G., Ghisellini, G., et al. 2008, ApJ, 685, L19 [NASA ADS] [CrossRef] [Google Scholar]
- Burrows, D., Hill, J., Nousek, J., et al. 2005, Space Sci. Rev., 120, 165 [NASA ADS] [CrossRef] [Google Scholar]
- Caito, L., Bernardini, M. G., Bianco, C. L., et al. 2009, A&A, 498, 501 [NASA ADS] [CrossRef] [EDP Sciences] [Google Scholar]
- Caito, L., Amati, L., Bernardini, M. G., et al. 2010, A&A, 521, A80 [NASA ADS] [CrossRef] [EDP Sciences] [Google Scholar]
- Cano, Z., Bersier, D., Guidorzi, C., et al. 2011, MNRAS, 413, 669 [NASA ADS] [CrossRef] [Google Scholar]
- Capozziello, S., & Izzo, L. 2010, A&A, 519, A73 [NASA ADS] [CrossRef] [EDP Sciences] [Google Scholar]
- Cavallo, G., & Rees, M. J. 1978, MNRAS, 183, 359 [NASA ADS] [CrossRef] [Google Scholar]
- Cenko, S. B., Perley, D. A., Junkkarinen, V., et al. 2009, GRB Coordinates Network, 9518, 1 [NASA ADS] [Google Scholar]
- Cherubini, C., Geralico, A. J. A., Rueda, H., & Ruffini, R. 2009, Phys. Rev. D, 79, 124002 [NASA ADS] [CrossRef] [Google Scholar]
- Costa, E., Frontera, F., Heise, J., et al. 1997, Nature, 387, 783 [NASA ADS] [CrossRef] [Google Scholar]
- Crider, A., Liang, E. P., Smith, I. A., et al. 1997, ApJ, 479, L39 [NASA ADS] [CrossRef] [Google Scholar]
- Daigne, F., & Mochkovitch, R. 2002, MNRAS, 336, 1271 [NASA ADS] [CrossRef] [Google Scholar]
- Daigne, F., Bosnjak, Z., & Dubus, G. 2009 [arXiv:0912.3743] [Google Scholar]
- Damour, T., & Ruffini, R. 1975, Phys. Rev. Lett., 35, 463 [Google Scholar]
- de Barros, G., Amati, L., Bernardini, M. G., et al. 2011, A&A, 529, A130 [NASA ADS] [CrossRef] [EDP Sciences] [Google Scholar]
- Dezalay, J.-P., Barat, C., Talon, R., et al. 1992, in AIP Conf. Ser. 265, ed. W. S. Paciesas, & G. J. Fishman, 304 [Google Scholar]
- Ducci, L., Sidoli, L., Mereghetti, S., Paizis, A., & Romano, P. 2009, MNRAS, 398, 2152 [NASA ADS] [CrossRef] [Google Scholar]
- Eichler, D., & Levinson, A. 2000, ApJ, 529, 146 [NASA ADS] [CrossRef] [Google Scholar]
- Evans, P. A., Beardmore, A. P., Page, K. L., et al. 2007, A&A, 469, 379 [NASA ADS] [CrossRef] [EDP Sciences] [Google Scholar]
- Evans, P. A., Beardmore, A. P., Page, K. L., et al. 2009, MNRAS, 397, 1177 [NASA ADS] [CrossRef] [Google Scholar]
- Fermi, E. 1949, Phys. Rev., 75, 1169 [NASA ADS] [CrossRef] [Google Scholar]
- Fermi, E. 1954, ApJ, 119, 1 [NASA ADS] [CrossRef] [Google Scholar]
- Fishman, G. J., Meegan, C. A., Wilson, R. B., et al. 1994, ApJS, 92, 229 [NASA ADS] [CrossRef] [Google Scholar]
- Fong, W., Berger, E., & Fox, D. B. 2010, ApJ, 708, 9 [NASA ADS] [CrossRef] [Google Scholar]
- Frontera, F., Amati, L., Costa, E., et al. 2000, ApJS, 127, 59 [NASA ADS] [CrossRef] [Google Scholar]
- Gehrels, N., Ramirez-Ruiz, E., & Fox, D. B. 2009, ARA&A, 47, 567 [NASA ADS] [CrossRef] [Google Scholar]
- Ghirlanda, G., Celotti, A., & Ghisellini, G. 2002, A&A, 393, 409 [NASA ADS] [CrossRef] [EDP Sciences] [Google Scholar]
- Ghirlanda, G., Celotti, A., & Ghisellini, G. 2003, A&A, 406, 879 [NASA ADS] [CrossRef] [EDP Sciences] [Google Scholar]
- Ghisellini, G., & Celotti, A. 1999, A&AS, 138, 527 [NASA ADS] [CrossRef] [EDP Sciences] [Google Scholar]
- Giannios, D. 2006, A&A, 457, 763 [NASA ADS] [CrossRef] [EDP Sciences] [Google Scholar]
- Golenetskii, S., Aptekar, R., Mazets, E., et al. 2009, GRB Coordinates Network, 9553, 1 [NASA ADS] [Google Scholar]
- Goodman, J. 1986, ApJ, 308, L47 [NASA ADS] [CrossRef] [Google Scholar]
- Granot, J., Piran, T., & Sari, R. 1999, ApJ, 513, 679 [NASA ADS] [CrossRef] [Google Scholar]
- Gruzinov, A., & Waxman, E. 1999, ApJ, 511, 852 [NASA ADS] [CrossRef] [Google Scholar]
- Guetta, D., Pian, E., & Waxman, E. 2011, A&A, 525, A53 [NASA ADS] [CrossRef] [EDP Sciences] [Google Scholar]
- Guiriec, S., Connaughton, V., Briggs, M. S., et al. 2011, ApJ, 727, L33 [NASA ADS] [CrossRef] [Google Scholar]
- Izzo, L., Bernardini, M. G., Bianco, C. L., et al. 2010, JKPS, 57 [Google Scholar]
- Kaneko, Y., Preece, R. D., Briggs, M. S., et al. 2006, ApJS, 166, 298 [NASA ADS] [CrossRef] [Google Scholar]
- Klebesadel, R. W. 1992, The durations of gamma-ray bursts, ed. C. Ho, R. I. Epstein, & E. E. Fenimore, 161 [Google Scholar]
- Klebesadel, R. W., Strong, I. B., & Olson, R. A. 1973, ApJ, 182, L85 [NASA ADS] [CrossRef] [Google Scholar]
- Kono, K., Daikyuji, A., Sonoda, E., et al. 2009, GRB Coordinates Network, 9568, 1 [NASA ADS] [Google Scholar]
- Kotov, Y., Kochemasov, A., Kuzin, S., et al. 2008, in COSPAR, Plenary Meeting, 37th COSPAR Scientific Assembly, 37, 1596 [Google Scholar]
- Kouveliotou, C., Meegan, C. A., Fishman, G. J., et al. 1993, ApJ, 413, L101 [NASA ADS] [CrossRef] [Google Scholar]
- Kumar, P., & McMahon, E. 2008a, MNRAS, 384, 33 [NASA ADS] [CrossRef] [Google Scholar]
- Kumar, P., & McMahon, E. 2008b, MNRAS, 384, 33 [NASA ADS] [CrossRef] [Google Scholar]
- Lazzati, D., & Begelman, M. C. 2010, ApJ, 725, 1137 [NASA ADS] [CrossRef] [Google Scholar]
- Longo, F., Moretti, E., Barbiellini, G., et al. 2009, GRB Coordinates Network, 9524, 1 [NASA ADS] [Google Scholar]
- McBreen, S. 2009, GRB Coordinates Network, 9535, 1 [NASA ADS] [Google Scholar]
- Medvedev, M. V. 2000, ApJ, 540, 704 [NASA ADS] [CrossRef] [Google Scholar]
- Medvedev, M. V., & Loeb, A. 1999, ApJ, 526, 697 [NASA ADS] [CrossRef] [Google Scholar]
- Medvedev, M. V., & Spitkovsky, A. 2009, ApJ, 700, 956 [NASA ADS] [CrossRef] [Google Scholar]
- Meegan, C. A. 1997, NASA STI/Recon Technical Report N, 1, 70758 [Google Scholar]
- Meegan, C. A., Fishman, G. J., Wilson, R. B., et al. 1992, Nature, 355, 143 [NASA ADS] [CrossRef] [Google Scholar]
- Meegan, C., Lichti, G., Bhat, P. N., et al. 2009, ApJ, 702, 791 [NASA ADS] [CrossRef] [Google Scholar]
- Mészáros, P. 2002, ARA&A, 40, 137 [NASA ADS] [CrossRef] [MathSciNet] [Google Scholar]
- Meszaros, P. 2006, Rep. Prog. Phys., 69, 2259 [NASA ADS] [CrossRef] [Google Scholar]
- Meszaros, P., & Rees, M. J. 1993, ApJ, 405, 278 [NASA ADS] [CrossRef] [Google Scholar]
- Mészáros, P., & Rees, M. J. 2000, ApJ, 530, 292 [NASA ADS] [CrossRef] [Google Scholar]
- Meszaros, P., Laguna, P., & Rees, M. J. 1993, ApJ, 415, 181 [NASA ADS] [CrossRef] [Google Scholar]
- Molinari, E., Vergani, S. D., Malesani, D., et al. 2007, A&A, 469, L13 [NASA ADS] [CrossRef] [EDP Sciences] [Google Scholar]
- Nandi, A., Rao, A. R., Chakrabarti, S. K., et al. 2009 [arXiv:0912.4126] [Google Scholar]
- Nousek, J. A., Kouveliotou, C., Grupe, D., et al. 2006, ApJ, 642, 389 [NASA ADS] [CrossRef] [Google Scholar]
- Paciesas, W. S., Meegan, C. A., Pendleton, G. N., et al. 1999, ApJS, 122, 465 [NASA ADS] [CrossRef] [Google Scholar]
- Paczynski, B. 1986, ApJ, 308, L43 [Google Scholar]
- Page, K. L., Starling, R. L. C., Fitzpatrick, G., et al. 2011, MNRAS, 416, 2078 [NASA ADS] [CrossRef] [Google Scholar]
- Panaitescu, A., & Meszaros, P. 1998, ApJ, 493, L31 [NASA ADS] [CrossRef] [Google Scholar]
- Panaitescu, A., & Mészáros, P. 2000, ApJ, 544, L17 [NASA ADS] [CrossRef] [Google Scholar]
- Patricelli, B., Bernardini, M. G., Bianco, C. L., et al. 2011, Int. J. Mod. Phys. D, 20, 1983 [NASA ADS] [CrossRef] [Google Scholar]
- Pe’er, A. 2008, ApJ, 682, 463 [NASA ADS] [CrossRef] [Google Scholar]
- Pe’er, A., & Zhang, B. 2006, ApJ, 653, 454 [NASA ADS] [CrossRef] [Google Scholar]
- Pe’er, A., Ryde, F., Wijers, R. A. M. J., Mészáros, P., & Rees, M. J. 2007, ApJ, 664, L1 [NASA ADS] [CrossRef] [Google Scholar]
- Pe’er, A., Zhang, B.-B., Ryde, F., et al. 2012, MNRAS, 420, 468 [NASA ADS] [CrossRef] [Google Scholar]
- Penacchioni, A. V., Ruffini, R., Izzo, L., et al. 2012, A&A, 538, A58 [NASA ADS] [CrossRef] [EDP Sciences] [Google Scholar]
- Peng, Z. Y., Yin, Y., Bi, X. W., Bao, Y. Y., & Ma, L. 2011, Astron. Nachr., 332, 92 [NASA ADS] [CrossRef] [Google Scholar]
- Piran, T. 1999, Phys. Rep., 314, 575 [NASA ADS] [CrossRef] [Google Scholar]
- Piran, T. 2005, Rev. Mod. Phys., 76, 1143 [Google Scholar]
- Piran, T., Shemi, A., & Narayan, R. 1993, MNRAS, 263, 861 [NASA ADS] [Google Scholar]
- Piran, T., Sari, R., & Zou, Y. 2009, MNRAS, 393, 1107 [NASA ADS] [CrossRef] [Google Scholar]
- Preece, R. D., Briggs, M. S., Giblin, T. W., et al. 2002, ApJ, 581, 1248 [NASA ADS] [CrossRef] [Google Scholar]
- Qin, Y.-P. 2002, A&A, 396, 705 [NASA ADS] [CrossRef] [EDP Sciences] [Google Scholar]
- Ramirez-Ruiz, E., & Fenimore, E. E. 2000, ApJ, 539, 712 [NASA ADS] [CrossRef] [Google Scholar]
- Rao, A. R., Malkar, J. P., Hingar, M. K., et al. 2011, ApJ, 728, 42 [NASA ADS] [CrossRef] [Google Scholar]
- Rees, M. J., & Meszaros, P. 1992, MNRAS, 258, 41 [NASA ADS] [CrossRef] [Google Scholar]
- Rees, M. J., & Meszaros, P. 1994, ApJ, 430, L93 [NASA ADS] [CrossRef] [Google Scholar]
- Rees, M. J., & Meszaros, P. 1998, ApJ, 496, L1 [NASA ADS] [CrossRef] [Google Scholar]
- Roming, P., Kennedy, T., Mason, K., et al. 2005, Space Sci. Rev., 120, 95 [NASA ADS] [CrossRef] [Google Scholar]
- Ruffini, R. 1999, A&AS, 138, 513 [NASA ADS] [CrossRef] [EDP Sciences] [Google Scholar]
- Ruffini, R. J. 2001, Analogies, new paradigms and observational data as growing factors of Relativistic Astrophysics [Google Scholar]
- Ruffini, R. 2011, ArXiv e-prints [Google Scholar]
- Ruffini, R., Salmonson, J. D., Wilson, J. R., & Xue, S. 2000, A&A, 359, 855 [NASA ADS] [Google Scholar]
- Ruffini, R., Bianco, C. L., Fraschetti, F., Xue, S.-S., & Chardonnet, P. 2001a, ApJ, 555, L113 [Google Scholar]
- Ruffini, R., Bianco, C. L., Fraschetti, F., Xue, S.-S., & Chardonnet, P. 2001b, ApJ, 555, L107 [Google Scholar]
- Ruffini, R., Bianco, C. L., Chardonnet, P., Fraschetti, F., & Xue, S. 2002, ApJ, 581, L19 [NASA ADS] [CrossRef] [Google Scholar]
- Ruffini, R., Bianco, C. L., Chardonnet, P., et al. 2003, in Cosmology and Gravitation, ed. M. Novello, & S. E. Perez Bergliaffa, AIP Conf. Ser., 668, 16 [Google Scholar]
- Ruffini, R., Bernardini, M. G., Bianco, C. L., et al. 2005, in XIth Brazilian School of Cosmology and Gravitation, ed. M. Novello, & S. E. Perez Bergliaffa, AIP Conf. Ser., 782, 42 [Google Scholar]
- Ruffini, R., Bernardini, M. G., Bianco, C. L., et al. 2007, in ESA SP, 622, 561 [Google Scholar]
- Ruffini, R., Chakrabarti, S. K., & Izzo, L. 2010a, Adv. Sp. Res., submitted [Google Scholar]
- Ruffini, R., Vereshchagin, G., & Xue, S.-S. 2010b, Phys. Rep., 487, 1 [Google Scholar]
- Ruffini, R., Izzo, L., Penacchioni, A. V., et al. 2011, PoS(Texas2010), 101 [Google Scholar]
- Ryde, F. 2004, ApJ, 614, 827 [NASA ADS] [CrossRef] [Google Scholar]
- Ryde, F., & Pe’er, A. 2009, ApJ, 702, 1211 [NASA ADS] [CrossRef] [Google Scholar]
- Ryde, F., Björnsson, C.-I., Kaneko, Y., et al. 2006, ApJ, 652, 1400 [NASA ADS] [CrossRef] [Google Scholar]
- Ryde, F., Axelsson, M., Zhang, B. B., et al. 2010, ApJ, 709, L172 [NASA ADS] [CrossRef] [Google Scholar]
- Rykoff, E. S., Aharonian, F., Akerlof, C. W., et al. 2009, ApJ, 702, 489 [NASA ADS] [CrossRef] [Google Scholar]
- Sakamoto, T., Ukwatta, T. N., & Barthelmy, S. D. 2009, GRB Coordinates Network, 9534, 1 [NASA ADS] [Google Scholar]
- Sari, R. 1997, ApJ, 489, L37 [NASA ADS] [CrossRef] [Google Scholar]
- Sari, R. 1998, ApJ, 494, L49 [NASA ADS] [CrossRef] [Google Scholar]
- Sari, R., & Piran, T. 1999, ApJ, 520, 641 [NASA ADS] [CrossRef] [Google Scholar]
- Sari, R., Piran, T., & Halpern, J. P. 1999, ApJ, 519, L17 [NASA ADS] [CrossRef] [Google Scholar]
- Schady, P. 2009, GRB Coordinates Network, 9527, 1 [NASA ADS] [Google Scholar]
- Schady, P., Baumgartner, W. H., Beardmore, A. P., et al. 2009, GRB Coordinates Network, 9512, 1 [NASA ADS] [Google Scholar]
- Schaefer, B. E. 2007, ApJ, 660, 16 [NASA ADS] [CrossRef] [Google Scholar]
- Shara, M. M., Zurek, D. R., Williams, R. E., et al. 1997, AJ, 114, 258 [NASA ADS] [CrossRef] [Google Scholar]
- Shemi, A. 1994, MNRAS, 269, 1112 [NASA ADS] [Google Scholar]
- Shemi, A., & Piran, T. 1990, ApJ, 365, L55 [NASA ADS] [CrossRef] [Google Scholar]
- Spitkovsky, A. 2008, ApJ, 673, L39 [NASA ADS] [CrossRef] [Google Scholar]
- Stern, B. E., & Poutanen, J. 2004, MNRAS, 352, L35 [NASA ADS] [CrossRef] [Google Scholar]
- Strong, I. B. 1975, in Neutron Stars, Black Holes and Binary X-ray Sources, ed. H. Gursky, & R. Ruffini, Astrophys Space Sci. Lib., 48, 47 [Google Scholar]
- Strong, I. B., & Klebesadel, R. W. 1974, Nature, 251, 396 [NASA ADS] [CrossRef] [Google Scholar]
- Strong, I. B., Klebesadel, R. W., & Olson, R. A. 1974, ApJ, 188, L1 [NASA ADS] [CrossRef] [Google Scholar]
- Tavani, M. 1996, ApJ, 466, 768 [NASA ADS] [CrossRef] [Google Scholar]
- Tavani, M. 1998, ApJ, 497, L21 [NASA ADS] [CrossRef] [Google Scholar]
- van Paradijs, J., Groot, P. J., Galama, T., et al. 1997, Nature, 386, 686 [NASA ADS] [CrossRef] [Google Scholar]
- van Paradijs, J., Kouveliotou, C., & Wijers, R. A. M. J. 2000, ARA&A, 38, 379 [NASA ADS] [CrossRef] [Google Scholar]
- Waxman, E. 1997, ApJ, 491, L19 [NASA ADS] [CrossRef] [Google Scholar]
- Zdziarski, A. A., Svensson, R., & Paczynski, B. 1991, ApJ, 366, 343 [NASA ADS] [CrossRef] [Google Scholar]
- Zhang, B.-B., Zhang, B., Liang, E.-W., et al. 2011, ApJ, 730, 141 [NASA ADS] [CrossRef] [Google Scholar]
All Tables
Time-resolved spectral analysis (8 keV–10 MeV) of the second episode in GRB 090618.
All Figures
|
Fig. 1 RT2 light curves of GRB 090618. |
| In the text | |
|
Fig. 2 Fermi-GBM flux light curve of GRB 090618 referring to the NaI (8–440 keV, upper panel) and BGO (260 keV–40 MeV, lower panel) detectors. |
| In the text | |
|
Fig. 3 Evolution of the Lorentz Γ factor until the transparency emission for a GRB of a fixed |
| In the text | |
|
Fig. 4 Fireshell temperature in the comoving and observer frame and the laboratory radius at the transparency emission (panels a) and b)), the Lorentz Γ factor at the transparency (panel c)) and the energy radiated in the P-GRB and in the afterglow in units of |
| In the text | |
|
Fig. 5 Two episode nature of GRB 090618. |
| In the text | |
|
Fig. 6 Time-integrated spectra for the first episode (from 0 to 50 s) of GRB 090618 fitted with the Band, |
| In the text | |
|
Fig. 7 Time-integrated spectra for the first 9 s of the second episode (from 50 to 59 s after the trigger time) of GRB 090618 fitted with the Band, |
| In the text | |
|
Fig. 8 Left panel, the time-integrated spectrum (8–440 keV) for the P-GRB emission episode (from 50 to 54 s after the trigger time) of GRB 090618 fitted with the blackbody + power-law models, |
| In the text | |
|
Fig. 9 Fireshell simulation, green line, and the sole blackbody emission, red line, of the time-integrated (t0 + 50, t0 + 54 s) spectrum of the P-GRB emission. The sum of the two components, the blue line, is the total simulated emission in the first 4 s of the second episode. |
| In the text | |
|
Fig. 10 Radial CBM density distribution for GRB 090618. The characteristic masses of each cloud are on the order of ~ 1022−24 g and 1016 cm in radii. |
| In the text | |
|
Fig. 11 Simulated light curve and time integrated (t0 + 58, t0 + 150 s) spectrum (8–440 keV) of the extended-afterglow of GRB 090618. |
| In the text | |
|
Fig. 12 Simulated time-integrated (t0 + 58, t0 + 66 s) count spectrum (8–440 keV) of the extended afterglow of GRB 090618 (upper panel), count spectrum (8 keV–10 MeV) of the main pulse emission (t0 + 58, t0 + 66), and best fit with a blackbody + power-law model (middle panel) and a simple power-law model (lower panel). |
| In the text | |
|
Fig. 13 Position of the first and second component of GRB 090618 in the Ep,i – Eiso plane with respect to the best fit of the Amati relation, as derived following the procedure described in Capozziello & Izzo (2010). The red circle corresponds to the first emission while the green circle corresponds to the second one. |
| In the text | |
|
Fig. 14 Hardness-ratio ratios for the Swift BAT data in two different energy channels: HR1 = cts(25–50 keV)/cts(15–25 keV), HR2 = cts(50–150 keV)/cts(15–50 keV). |
| In the text | |
|
Fig. 15 Hardness-ratio for the Fermi data. We considered the cts observed in the (260 keV–40 MeV) energy range over the (8–260 keV) energy range. The time on the x-axis is reported in terms of the mission elapsed time (MET). Several negative data points arise because of noise, in other words the non-presence of GRB emission, in the background-subtracted BGO count light curve. |
| In the text | |
|
Fig. 16 Evolution of the BB+powerlaw spectral model in the ν F(ν) spectrum of the first emission of GRB 090618. It shows the cooling of the blackbody and of the associated non-thermal component with time. We only plot the fitting functions for clarity. |
| In the text | |
|
Fig. 17 Evolution of the kT observed temperature of the blackbody component and the corresponding evolution of the power-law photon index. The blue line in the upper panel corresponds to the fit of the time evolution of the temperature with a broken power-law function. It shows a break time tb around 11 s after the trigger time, as obtained from the fitting procedure. |
| In the text | |
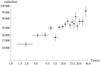 |
Fig. 18 Evolution of the first episode emitter radius, as given by Eq. (8). |
| In the text | |
Current usage metrics show cumulative count of Article Views (full-text article views including HTML views, PDF and ePub downloads, according to the available data) and Abstracts Views on Vision4Press platform.
Data correspond to usage on the plateform after 2015. The current usage metrics is available 48-96 hours after online publication and is updated daily on week days.
Initial download of the metrics may take a while.