Free Access
Fig. 9
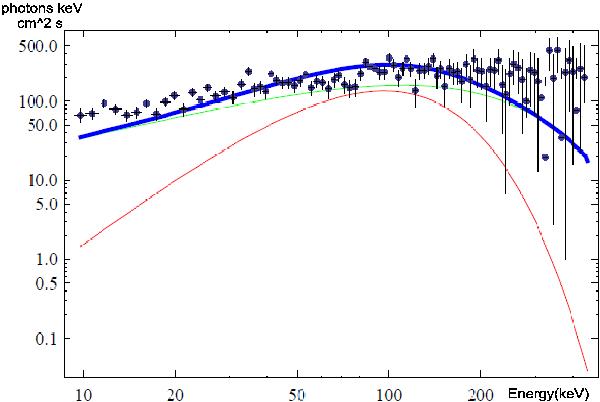
Fireshell simulation, green line, and the sole blackbody emission, red line, of the time-integrated (t0 + 50, t0 + 54 s) spectrum of the P-GRB emission. The sum of the two components, the blue line, is the total simulated emission in the first 4 s of the second episode.
Current usage metrics show cumulative count of Article Views (full-text article views including HTML views, PDF and ePub downloads, according to the available data) and Abstracts Views on Vision4Press platform.
Data correspond to usage on the plateform after 2015. The current usage metrics is available 48-96 hours after online publication and is updated daily on week days.
Initial download of the metrics may take a while.