Fig. 17
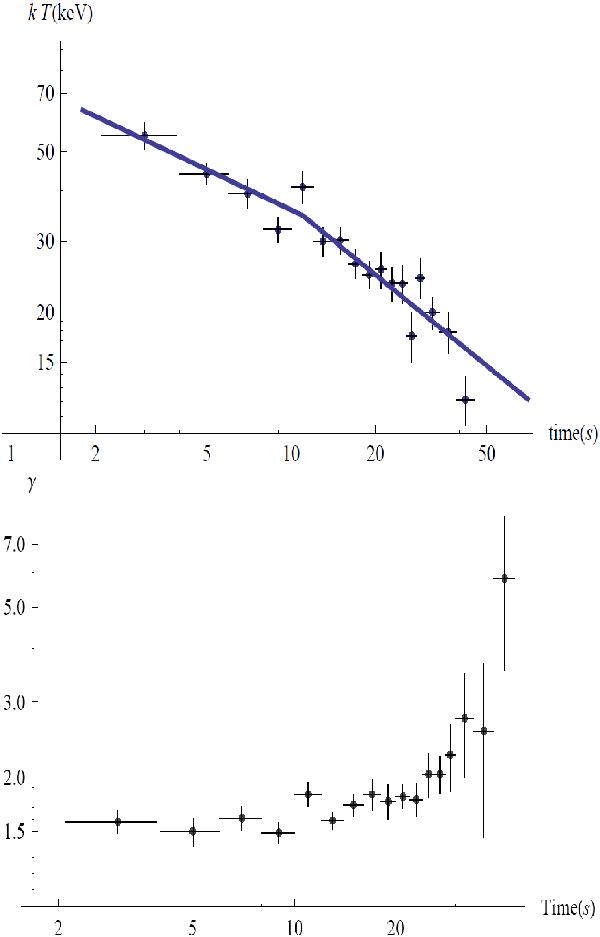
Evolution of the kT observed temperature of the blackbody component and the corresponding evolution of the power-law photon index. The blue line in the upper panel corresponds to the fit of the time evolution of the temperature with a broken power-law function. It shows a break time tb around 11 s after the trigger time, as obtained from the fitting procedure.
Current usage metrics show cumulative count of Article Views (full-text article views including HTML views, PDF and ePub downloads, according to the available data) and Abstracts Views on Vision4Press platform.
Data correspond to usage on the plateform after 2015. The current usage metrics is available 48-96 hours after online publication and is updated daily on week days.
Initial download of the metrics may take a while.