| Issue |
A&A
Volume 542, June 2012
|
|
|---|---|---|
| Article Number | L31 | |
| Number of page(s) | 4 | |
| Section | Letters | |
| DOI | https://doi.org/10.1051/0004-6361/201219486 | |
| Published online | 05 June 2012 | |
The bright end of the luminosity function at z ~ 9⋆
1 Université de Toulouse, UPS-OMP, IRAP, Toulouse, France
2 CNRS, IRAP, 14, avenue Edouard Belin, 31400 Toulouse, France
e-mail: nicolas.laporte@irap.omp.eu; roser@irap.omp.eu; matthew.hayes@irap.omp.eu; frederic.boone@irap.omp.eu;
3 Laboratoire d’Astrophysique de Marseille, CNRS – Université Aix-Marseille, 38 rue Frédéric Joliot-Curie, 13388 Marseille Cedex 13, France
e-mail: jean-paul.kneib@oamp.fr
4 Centre de Recherche Astrophysique de Lyon, University Lyon 1, 9 Avenue Charles André, 69561 Saint Genis Laval, France
e-mail: johan.richard@univ-lyon1.fr
5 Observatoire de Genève, Université de Genève, 51 Ch. des Maillettes, 1290 Versoix, Switzerland
e-mail: Daniel.Schaerer@unige.ch
6 LERMA, Observatoire de Paris and CNRS, 61 Avenue de l’Observatoire, 75014 Paris, France
e-mail: Francoise.Combes@obspm.fr
Received: 26 April 2012
Accepted: 18 May 2012
Context. We present additional constraints on the galaxy luminosity function at z ~ 9 based on observations carried out with ESO/VLT FORS2, HAWK-I, and X-Shooter around the lensing cluster A2667, as part of our project designed to select z ~ 7–10 candidates accessible to spectroscopy. We find that only one selected J-dropout source in this field fulfills the color and magnitude criteria. This source was recently confirmed as a mid-z interloper based on X-Shooter spectroscopy.
Aims. Owing to the considerable depth and area covered by our survey, we are able to set strong constraints on the bright end of the galaxy luminosity function and hence on the star formation history at very high redshift.
Methods. We used our non-detection of reliable J-dropout sources over the ~36 arcmin2 field of view towards A2667 to carefully determine the lens-corrected effective volume and the corresponding upper limit to the density of sources.
Results. Our strongest limit is obtained for Φ(M1500 = −21.4 ± 0.50) < 6.70 × 10⁻⁶ Mpc-3 mag-1 at z ~ 9. A maximum-likelihood fit of the luminosity function to all available data points including the present new result yields M⋆ > −19.7 with fixed α = −1.74 and Φ⋆ = 1.10 × 10⁻³ Mpc-3. The corresponding star-formation rate density should be ρSFR < 5.97 × 10⁻³ M⊙ yr-1 Mpc3 at z ~ 9. These results are in good agreement with the most recent estimates already published for this range of redshift and luminosity domain.
Conclusions. This new result confirms previously measured decreases in the density of luminous galaxies at very high redshift, hence provides strong constraints on the design of future surveys aiming to explore the very high-redshift Universe.
Key words: galaxies: high-redshift / dark ages, reionization, first stars
© ESO, 2012
1. Introduction
Understanding the formation and evolution of the first galaxies is one of the major challenges of modern astronomy. Over the past dozen years, many projects and instruments have been developed to push the boundaries of our Universe, such as the Hubble Ultra Deep Field (Beckwith et al. 2003). The role played by the first luminous objects in the Universe during cosmic reionization is still unclear. One way to explore these first epochs is to constrain the number density of galaxies over cosmic time, thus establish the star formation history (SFH) representing the evolution of the star formation rate density (SFRd) over cosmic time. Two complementary approaches have been adopted to constrain the luminosity function : the observations of both large blank fields to select the brightest sources and lensing clusters, which are then used as gravitational telescopes to help select the faintest sources. Our group has conducted an observing program combining these two approches aimed at selecting z ~ 7−10 candidates accessible to spectroscopy, namely the WIRCAM Ultra Deep Survey (WUDS) at CFHT on the CFHTLS-D3 Groth Strip field (Pello et al., to be submitted), and a lensing survey (Laporte et al. 2011, hereafter L11), that is central to this Letter.
The galaxy luminosity function (LF) has been relatively well-constrained up to redshift z ~ 6. Beyond this redshift however, the contamination by low-z interlopers becomes more severe because a majority of samples are only constrained by photometric data, hence the results at these redshifts could be seriously affected by contamination (Boone et al. 2011). The only way to get rid of this problem is to spectroscopically confirm, if not all, at least a substantial fraction of sources in a given sample, an aim that is beyond the capabilities of present-day facilities. Only the brightest samples, including highly magnified sources, can presently be confirmed. Fortunately, galaxies of intermediate-to-bright luminosity (rest-frame ultraviolet (UV) magnitude MUV ~ −20.5 to −22) trace the most important region of the LF, where most of the evolution is currently observed as a function of redshift (e.g. Bouwens et al. 2010). However, at z ~ 7−8 the LF has started to be constrained by observations from ground-based or space observatories (such as Oesch et al. 2012; McLure et al. 2011; Castellano et al. 2010). Some attempts have been made up to z ~ 10 but these lack spectroscopic confirmation (Bouwens et al. 2011a).
We previously obtained deep images of the lensing cluster A2667 with ESO/VLT FORS 2 and HAWK-I in I, z, Y, J, H, and Ks bands. All details regarding these observations and data reduction can be found in L11. IRAC data between 3.6 and 8 μm, and MIPS 24 μm data were also included in the analysis when available (Spitzer Space Telescope, Werner et al. 2004; Fazio et al. 2004; Rieke et al. 2004). On the basis of these data, ten photometric candidates at z ~ 7−10 were selected based on the usual dropout technique. Among them, only one candidate, J1, is consistent with the z ~ 9 J-drop selection criteria, having an observed mH = 25.21 ± 0.08 and a modest magnification factor μ = 1.3. Despite an excellent fit to its photometric SED at high-z, the reliability of this source was considered dubious by L11 given the detection of a faint compact counterpart in the HST F850LP/ACS image, with z850 = 27.39 ± 0.18. The candidate J1 was subsequently confirmed as a z = 2.082 interloper based on the detection of five emission lines ( [OIII ] λ5007,4959, Hα, Hβ, and Lyα) with ESO/VLT X-Shooter spectroscopy (see Hayes et al. 2012, submitted, for more details).
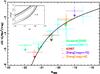 |
Fig. 1 Luminosity function at z ~ 9 showing the upper limits resulting from the absence of J-dropout sources in our HAWK-I survey (red dots including cosmic variance), upper limit from Bouwens et al. (2008) found in the HUDF and GOODS field of view (green dot). We also plot points obtained from the z ~ 9 candidate of Zheng et al. (2012) considering a magnification factor of μ ~ 15, and the amplification factor μ ~ 8 obtained using the model by Smith et al. (2009) for MACS1149+22 (error bars take into account the cosmic variance computed from Trenti & Stiavelli (2008)) and points from Lorenzoni et al. (2011) at z ~ 8–9. The last data set is only displayed for comparison purposes; it was not used for the computation of the LF at z ~ 9 given the difference in the redshift domain. The dark line displays the Schechter function using M⋆ = −19.7, α = −1.74, and Φ⋆ = 1.10 × 10⁻³ Mpc-3 mag-1. The small panel displays the likelihood contours for the 1, 2 and 3σ confidence regions for a fixed α = −1.74. |
In this letter, we report new constraints on the LF at z ~ 9 based on the non-detection of realiable J-dropout candidates over the field of view towards the lensing cluster A2667. The largest magnification regimes cannot be addressed with a single cluster because the effective surfaces/volumes explored in this domain are too small to retrieve significant results. Therefore, this study is limited to the low-to-moderate magnification regime, where this pilot study provides the most interesting results on the LF compared to previous studies, in particular blank-field surveys. In Sect. 2, we introduce the method used to constrain the bright end of the LF at z ~ 9, in particular to determine the lens-corrected effective volume and the corresponding upper-limit on the density of sources. The constraints derived on the SFH at z ~ 9 are presented in Sect. 3. A brief discussion and conclusions are given in Sect. 4. Throughout this paper, a concordance cosmology is adopted, with ΩΛ = 0.7, Ωm = 0.3, and H0 = 70 km s-1 Mpc-1. All magnitudes are given in the AB system (Oke & Gunn 1983).
2. The luminosity function at z ~ 9
We use our non-detection of realiable J-dropout candidates over the field of view towards A2667 to carefully determine the lens-corrected effective volume at z ~ 9 and the corresponding upper limits on the density of sources. In the following, we only consider the field of view corresponding to the surface covered with more than 75% of the total exposure time in all filters. A mask was also applied to remove all the noisy regions within and around galaxies from the subsequent analysis. The region masked is only ~12% of the total area, but reaches a maximum of ~30% of the cluster core extent within the central 1 arcmin2 centered on the cD. The final effective area is ~36 arcmin2.
The selection criteria adopted by L11 for 8.5 ≲ z ≲ 9.5 candidates require a detection above 5σ level within a 1.3′′ diameter aperture in H, i.e. H < 26.22, and the usual color selection of J − H > 0.76, H − Ks < 0.5, and J − H > 1.3 × (H − Ks) + 0.76. In practice, the depth in the J-band limits the reliability of the J-dropout selection to H < 26.0, corresponding to a completeness level of higher than 90%. Absolute magnitudes in the ~1500 Å domain (M1500) are derived from H-band magnitudes assuming a flat spectrum.
Compared to blank fields, data obtained in gravitational-lensing fields need to be corrected for both magnification and dilution effects. A magnification factor μ introduces an enhancement to the observed luminosity, depending on the redshift of the source and the location of the image on the sky, without modifying the color-selection window. Dilution reduces the effective surface covered by the survey, in such a way that a pixel affected by a magnification factor μ has an effective area reduced by the same factor on the corresponding source plane. We used the lensing model for A2667 originally obtained by Covone et al. (2006) to compute the magnification map at z ~ 9 using the public software Lenstool1, including the Markov chain Monte Carlo optimization method of Jullo et al. (2007). We explicitly compute the effective surface probed by the survey by means of a pixel-to-pixel integration of the magnification map, after masking the pixels lying in the object’s mask, as explained above. The effective surface is 32.55 arcmin2, corresponding to a covolume of 57602.5 Mpc3 between redshifts of about 8.5 and 9.5.
The effective limiting magnitude for the detection of z ~ 9 candidates, however, depends on the magnification factor μ. To take this effect into account when deriving upper limits to the density of sources, we considered different magnification regimes, with effective surface/covolume decreasing with increasing μ. Table 1 summarizes these results and provides the derived non-detection constraints on the LF. The areas, volumes, and limiting magnitudes quoted in this table are effective lens-corrected ones. Given the low-to-moderate magnification regimes explored in this study, the uncertainties in the effective surveyed volumes due to lensing-modeling uncertainties are considered negligible (see also Maizy et al. 2010 for details). The strongest limit is obtained for Φ(M1500 = −21.4 ± 0.50) < 6.70 × 10⁻⁶ Mpc-3 at a 68% confidence level assuming Poissonian statistics. Figure 1 displays the independent data points on the LF, together with previous results from the literature. We also computed points from Zheng et al. (2012), for comparison purposes, using the Monte Carlo approach taking into account the probability distribution as a function of redshift (Bolzonella et al. 2002) and considering two different values for the magnification : μ ~ 15, reported by the authors, and μ ~ 8 obtained from the MACS1149+22 model by Smith et al. (2009).
Upper limits to the luminosity function at z = 8.5–9.5, for different magnification regimes and UV luminosities.
We adopted the Schechter parametrization of the LF (Schechter 1976)  (1)to set constraints on M⋆ using a χ2 minimization, assuming a fixed α = −1.74 (Bouwens et al. 2008). Our two independent limits in Φ at M1500 = −21.35 and –20.44 were combined to the available upper limits from the HUDF and GOODS fields in the same redshift domain as Bouwens et al. (2008). As shown in Fig. 1, given the degeneracy between Φ⋆ and M⋆, and the small number of available data points at z ~ 9, we can only derive a limit for Φ⋆ when assuming M⋆ or vice-versa. It has been shown that Φ⋆ does not seem to evolve significantly from z ~ 4 to 9, whereas M⋆ clearly decreases over the redshift range z ~ 4–8 (e.g. Bouwens et al. (2011b)). Assuming this no-evolution, we used a fixed Φ⋆ = 1.10 × 10⁻³ Mpc-3 and btained M⋆ > − 19.7. This result is also consistent with previous findings (Bouwens et al. 2008).
3. The star formation history up to z ~ 9
The SFH of the Universe can be explored by measuring the evolution of the SFRd over cosmic time. Using the shape of the LF found in the previous section, we are able to constrain the SFRd at z ~ 9. This density is deduced from the UV density produced by Lyman break galaxies and usually defined by 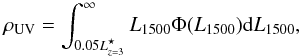 (2)where
  erg s-1 Å-1 and Φ(L1500) is the UV LF. The lower integration bound was chosen in order to facilitate the comparison with previous studies (see Sect. 4). The conversion between UV flux density and SFRd is done using the Kennicutt (1998) relation given by
  (3)As a result, the SFRd limit at z ~ 9 is found, using M⋆ = −19.7, to be ρSFR < 5.97 × 10⁻³ M⊙ yr-1 Mpc3. Figure 2 shows the evolution of the SFRd with cosmic time including results already published over a wide range of redshift. For consistency, all points in this figure up to z ~ 7 have been corrected for dust extinction (at z ≥ 8, we assumed that dust attenuation is negligible). A parameterization as a function of redshift was derived based on the expression given by Schiminovich et al. (2005) for dust extinction as a function of the UV slope, whose evolution with redshift is taken from Schiminovich et al. (2005) for z ≤ 3.5, and extended from z ~ 3.5 up to 7 according to Bouwens et al. (2011b). The expression2 given by Cole et al. (2001) is used to fit the SFH, in order to compare the above value of ρSFR with the trend observed between redshifts of about z ~ 3 and 8. The best-fit parameters of the Cole function are found to be a = 0.0, b = 0.10, c = 2.85, and d = 4.65. As seen in Fig. 2, our result is compatible with the evolution observed below z ~ 8, and also consistent with the SFRd limit published at z ~ 10 by Bouwens et al. (2011a).
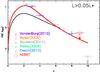 |
Fig. 2 Star formation history of the Universe including the result of the present study (empty red circle symbol) and the data of Wyder et al. (2005), Reddy & Steidel (2009), van der Burg et al. (2010), and Oesch et al. (2012). For consistency, all points in this figure have been corrected for dust reddening (see text). The red line shows the parametrization of the corrected SFH following Cole et al. (2001) (see text) and the dark line displays the evolution of the uncorrected SFRd (i.e. without dust extinction correction; the corresponding points are not shown to avoid confusion). |
4. Discussion and conclusions
Over the ~ 36 arcmin2 field of view of our survey around the lensing cluster A2667, only one J-dropout candidate was retained (L11). This source, which had been considered as a possible interloper by L11, was confirmed to be at z = 2.082 based on the detection of five emission lines with ESO/VLT X-Shooter spectroscopy (see Hayes et al., submitted, for more details). The non-detection of J-dropout candidates in our survey is consistent with previous non-detections reported by Bouwens et al. (2008) in the HDF, HUDF, and GOODS fields (4.8, 9.1, and 9.3 arcmin2 respectively), whose mH (5σ, 0.6 arcsec aperture) typically range between ~27.6 and 26.6, and which are complementary in terms of the area covered and effective depth.
Assuming that there is no reliable z ~ 9 candidate in our survey up to mH = 26.0 + 2.5 × log (μ), we have taken advantage of the survey depth and large area covered to set strong constraints on the bright end of the LF and hence on the SFH at very high redshift by a careful determination of the lens-corrected effective volume and corresponding upper-limits on the density of sources. We have considered different magnification regimes, with effective surface/covolume decreasing with increasing μ. The strongest limit is obtained for Φ(M1500 = −21.4 ± 0.50) < 6.70 × 10⁻⁶ Mpc-3 mag-1 at a 68% confidence level assuming Poissonian statistics.
We have combined our two independent LF limits at M1500 = −21.35 and –20.44 with the available upper limits for the HUDF and GOODS fields, extracted from Bouwens et al. (2008), to derive the Schechter parameters for the LF. Assuming a fixed α = −1.74 and no-evolution in Φ⋆ = 1.10 × 10⁻³ Mpc-3, we have derived a constraint on M⋆ > − 19.7. This result is consistent with previous findings, e.g. Bouwens et al. (2008), Castellano et al. (2010) (M⋆(z ~ 7) ≈ − 20.24) and Oesch et al. (2012) (M⋆(z ~ 8) ≈ − 19.80). The corresponding SFRd given the previous LF should be ρSFR < 5.97 × 10⁻³M⊙ yr-1 Mpc3 at z ~ 9. These results are in good agreement with the most recent estimates published for this range of redshift and luminosity, and confirm the decrease in the density of luminous galaxies from z ~ 6 to 9, hence provide strong constraints on the design of future surveys aiming to explore the very high-redshift Universe.
Several ongoing projects such as CLASH (Postman et al. 2012), CANDELS (Grogin et al. 2011) or BoRG (Trenti et al. 2011) are currently attempting to constrain the evolution of galaxies beyond z ~ 6. However, all candidates targeted
by these projects require confirmation by deep spectroscopic observations that are beyond the limits of present spectrographs. Near-IR spectrographs will also be required to understand the nature of the (extreme) mid-z interlopers found in these deep surveys. The arrival of multi-object near-IR facilities such as EMIR/GTC (Balcells et al. 2000; Pelló et al. 2011) or KMOS/VLT (Sharples et al. 2006; Sharples et al. 2010) will provide a substantial progress in this area. Given the results presented in this paper, increasing by a factor of about ten the sample of lensing clusters with deep multi-wavelength photometry over a field of view similar to our survey of A2667, is expected to set tight constraints on the intermediate-to-high luminosity domain at z ~ 7 − 10, and substantially improve the selection of spectroscopic targets. Such a cluster sample would provide a reference frame allowing us to connect the results obtained in blank fields with those obtained in the strongest magnification regimes, as demonstrated in this Letter.

Acknowledgments
Part of this work was supported by the French CNRS, the French Programme National de Cosmologie et Galaxies (PNCG), as well as by the Swiss National Science Foundation. This work recieved support from the Agence Nationale de la Recherche bearing the reference ANR-09-BLAN-0234.
References
- Balcells, M., Guzman, R., Patron, J., et al. 2000, in SPIE Conf. Ser. 4008, ed. M. Iye, & A. F. Moorwood, 797 [Google Scholar]
- Beckwith, S. V. W., Caldwell, J., Clampin, M., et al. 2003, in BAAS, 35, Am. Astron. Soc. Meet. Abstracts #202, 723 [Google Scholar]
- Bolzonella, M., Pelló, R., & Maccagni, D. 2002, A&A, 395, 443 [NASA ADS] [CrossRef] [EDP Sciences] [Google Scholar]
- Boone, F., Schaerer, D., Pelló, R., et al. 2011, A&A, 534, A124 [NASA ADS] [CrossRef] [EDP Sciences] [Google Scholar]
- Bouwens, R. J., Illingworth, G. D., Franx, M., & Ford, H. 2008, ApJ, 686, 230 [NASA ADS] [CrossRef] [Google Scholar]
- Bouwens, R. J., Illingworth, G. D., Labbe, I., et al. 2011a, Nature, 469, 504 [NASA ADS] [CrossRef] [PubMed] [Google Scholar]
- Bouwens, R. J., Illingworth, G. D., Oesch, P. A., et al. 2011b, ApJ, submitted [arXiv:1109.0994] [Google Scholar]
- Castellano, M., Fontana, A., Paris, D., et al. 2010, A&A, 524, A28 [NASA ADS] [CrossRef] [EDP Sciences] [Google Scholar]
- Cole, S., Norberg, P., Baugh, C. M., et al. 2001, MNRAS, 326, 255 [NASA ADS] [CrossRef] [Google Scholar]
- Covone, G., Kneib, J.-P., Soucail, G., et al. 2006, A&A, 456, 409 [NASA ADS] [CrossRef] [EDP Sciences] [Google Scholar]
- Fazio, G. G., Hora, J. L., Allen, L. E., et al. 2004, ApJS, 154, 10 [NASA ADS] [CrossRef] [Google Scholar]
- Grogin, N. A., Kocevski, D. D., Faber, S. M., et al. 2011, ApJS, 197, 35 [NASA ADS] [CrossRef] [Google Scholar]
- Hayes, M., Laporte, N., Pelló, R., Schaerer, D., & Le Borgne, F. 2012, MNRAS, submitted [Google Scholar]
- Jullo, E., Kneib, J.-P., Limousin, M., et al. 2007, New J. Phys., 9, 447 [Google Scholar]
- Kennicutt, Jr., R. C. 1998, ApJ, 498, 541 [NASA ADS] [CrossRef] [Google Scholar]
- Laporte, N., Pelló, R., Schaerer, D., et al. 2011, A&A, 531, A74 (L11) [NASA ADS] [CrossRef] [EDP Sciences] [Google Scholar]
- Lorenzoni, S., Bunker, A. J., Wilkins, S. M., et al. 2011, MNRAS, 414, 1455 [NASA ADS] [CrossRef] [Google Scholar]
- Maizy, A., Richard, J., de Leo, M. A., Pelló, R., & Kneib, J. P. 2010, A&A, 509, A105 [NASA ADS] [CrossRef] [EDP Sciences] [Google Scholar]
- McLure, R. J., Dunlop, J. S., de Ravel, L., et al. 2011, MNRAS, 418, 2074 [NASA ADS] [CrossRef] [Google Scholar]
- Oesch, P. A., Bouwens, R. J., Illingworth, G. D., et al. 2012, ApJ, submitted [arXiv:1201.0755] [Google Scholar]
- Oke, J. B., & Gunn, J. E. 1983, ApJ, 266, 713 [NASA ADS] [CrossRef] [Google Scholar]
- Pelló, R., Garzón, F., Balcells, M., et al. 2011, in SF2A-2011: Proc. Annual meeting of the French Society of Astronomy and Astrophysics, ed. G. Alecian, K. Belkacem, R. Samadi, & D. Valls-Gabaud, 161 [Google Scholar]
- Postman, M., Coe, D., Benitez, N., et al. 2012, ApJS, 199, 25 [NASA ADS] [CrossRef] [Google Scholar]
- Reddy, N. A., & Steidel, C. C. 2009, ApJ, 692, 778 [NASA ADS] [CrossRef] [Google Scholar]
- Rieke, G. H., Young, E. T., Engelbracht, C. W., et al. 2004, ApJS, 154, 25 [NASA ADS] [CrossRef] [Google Scholar]
- Schechter, P. 1976, ApJ, 203, 297 [Google Scholar]
- Schiminovich, D., Ilbert, O., Arnouts, S., et al. 2005, ApJ, 619, L47 [NASA ADS] [CrossRef] [Google Scholar]
- Sharples, R., Bender, R., Bennett, R., et al. 2006, New Astron. Rev., 50, 370 [Google Scholar]
- Sharples, R., Bender, R., Agudo Berbel, A., et al. 2010, in SPIE Conf. Ser., 7735 [Google Scholar]
- Smith, G. P., Ebeling, H., Limousin, M., et al. 2009, ApJ, 707, L163 [NASA ADS] [CrossRef] [Google Scholar]
- Trenti, M., & Stiavelli, M. 2008, ApJ, 676, 767 [Google Scholar]
- Trenti, M., Bradley, L. D., Stiavelli, M., et al. 2011, ApJ, 727, L39 [NASA ADS] [CrossRef] [Google Scholar]
- van der Burg, R. F. J., Hildebrandt, H., & Erben, T. 2010, A&A, 523, A74 [NASA ADS] [CrossRef] [EDP Sciences] [Google Scholar]
- Werner, M. W., Roellig, T. L., Low, F. J., et al. 2004, ApJS, 154, 1 [Google Scholar]
- Wyder, T. K., Treyer, M. A., Milliard, B., et al. 2005, ApJ, 619, L15 [Google Scholar]
- Zheng, W., Postman, M., Zitrin, A., et al. 2012, Nature, submitted [arXiv:1204.2305] [Google Scholar]
All Tables
Upper limits to the luminosity function at z = 8.5–9.5, for different magnification regimes and UV luminosities.
All Figures
|
Fig. 1 Luminosity function at z ~ 9 showing the upper limits resulting from the absence of J-dropout sources in our HAWK-I survey (red dots including cosmic variance), upper limit from Bouwens et al. (2008) found in the HUDF and GOODS field of view (green dot). We also plot points obtained from the z ~ 9 candidate of Zheng et al. (2012) considering a magnification factor of μ ~ 15, and the amplification factor μ ~ 8 obtained using the model by Smith et al. (2009) for MACS1149+22 (error bars take into account the cosmic variance computed from Trenti & Stiavelli (2008)) and points from Lorenzoni et al. (2011) at z ~ 8–9. The last data set is only displayed for comparison purposes; it was not used for the computation of the LF at z ~ 9 given the difference in the redshift domain. The dark line displays the Schechter function using M⋆ = −19.7, α = −1.74, and Φ⋆ = 1.10 × 10⁻³ Mpc-3 mag-1. The small panel displays the likelihood contours for the 1, 2 and 3σ confidence regions for a fixed α = −1.74. |
| In the text | |
|
Fig. 2 Star formation history of the Universe including the result of the present study (empty red circle symbol) and the data of Wyder et al. (2005), Reddy & Steidel (2009), van der Burg et al. (2010), and Oesch et al. (2012). For consistency, all points in this figure have been corrected for dust reddening (see text). The red line shows the parametrization of the corrected SFH following Cole et al. (2001) (see text) and the dark line displays the evolution of the uncorrected SFRd (i.e. without dust extinction correction; the corresponding points are not shown to avoid confusion). |
| In the text | |
Current usage metrics show cumulative count of Article Views (full-text article views including HTML views, PDF and ePub downloads, according to the available data) and Abstracts Views on Vision4Press platform.
Data correspond to usage on the plateform after 2015. The current usage metrics is available 48-96 hours after online publication and is updated daily on week days.
Initial download of the metrics may take a while.