Fig. 1
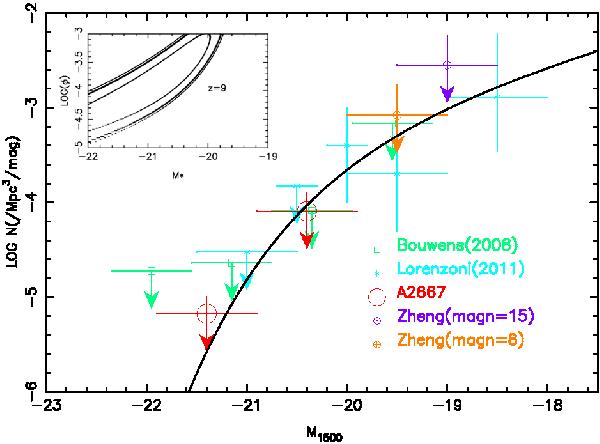
Luminosity function at z ~ 9 showing the upper limits resulting from the absence of J-dropout sources in our HAWK-I survey (red dots including cosmic variance), upper limit from Bouwens et al. (2008) found in the HUDF and GOODS field of view (green dot). We also plot points obtained from the z ~ 9 candidate of Zheng et al. (2012) considering a magnification factor of μ ~ 15, and the amplification factor μ ~ 8 obtained using the model by Smith et al. (2009) for MACS1149+22 (error bars take into account the cosmic variance computed from Trenti & Stiavelli (2008)) and points from Lorenzoni et al. (2011) at z ~ 8–9. The last data set is only displayed for comparison purposes; it was not used for the computation of the LF at z ~ 9 given the difference in the redshift domain. The dark line displays the Schechter function using M⋆ = −19.7, α = −1.74, and Φ⋆ = 1.10 × 10⁻³ Mpc-3 mag-1. The small panel displays the likelihood contours for the 1, 2 and 3σ confidence regions for a fixed α = −1.74.
Current usage metrics show cumulative count of Article Views (full-text article views including HTML views, PDF and ePub downloads, according to the available data) and Abstracts Views on Vision4Press platform.
Data correspond to usage on the plateform after 2015. The current usage metrics is available 48-96 hours after online publication and is updated daily on week days.
Initial download of the metrics may take a while.