| Issue |
A&A
Volume 542, June 2012
|
|
|---|---|---|
| Article Number | L25 | |
| Number of page(s) | 4 | |
| Section | Letters | |
| DOI | https://doi.org/10.1051/0004-6361/201219026 | |
| Published online | 25 May 2012 | |
The solar hydrogen Lyman α to Lyman β line ratio
1 Institut d’Astrophysique Spatiale (IAS), CNRS – Université Paris-Sud, 91405 Orsay, France
e-mail: This email address is being protected from spambots. You need JavaScript enabled to view it.
2 Max-Planck-Institut für Sonnensystemforschung, Max-Planck -Str. 2, 37191 Katlenburg-Lindau, Germany
3 Laboratory for Atmospheric and Space Physics (LASP), University of Colorado, Boulder, Colorado, USA
Received: 13 February 2012
Accepted: 25 April 2012
Abstract
Aims. We investigate the variation in the solar hydrogen Lyman α (Lyα) to Lyman β (Lyβ) line ratio as a function of the solar activity by taking into account new results obtained by SoHO/SUMER and TIMED/SEE.
Methods. We reanalyze data of quiet and active regions previously collected with the LPSP multichannel instrument on OSO8. We then re-examine data obtained on the solar disk with SUMER and compare them with previous data. In a second step, we use the full Sun H i Lyβ profiles to determine the Lyβ contribution to the SEE profiles obtained with a 0.4 nm full width at half-maximum. The variation in the Lyα to Lyβ line ratio is then measured for part of the solar cycle 23 (2002–2008).
Results. We determine the radiance line ratio of the solar H i Lyα to Lyβ line for a quiet Sun area and the relation between the ratio of the Lyα to Lyβ irradiance and the Lyα solar irradiance.
Key words: Sun: chromosphere / Sun: UV radiation / Sun: activity / Sun: heliosphere
© ESO, 2012
1. Introduction
The solar hydrogen Lyman lines provide a tool to study the solar atmosphere from the chromosphere to the low transition region. The H i Lyα resonance line is the strongest line in the VUV (121.57 nm, 1s 2S−2p 2P transition); the H i Lyβ line (102.57 nm, 1s 2S−3p 2P transition) is strongly related to the visible Balmer Hα line (656.28 nm, 2s 2S−3p 2P), which has been used to generate and test solar atmosphere models for decades. Most chromospheric features (network, sunspot, prominence, ...) have specific signatures in the hydrogen lines. Moreover, for most features, the hydrogen lines represent the bulk of the radiative losses in the upper chromosphere (e.g. Vernazza et al. 1981).
The solar irradiance of the hydrogen VUV lines has a strong impact on the solar system (interplanetary medium, planetary atmospheres, and cometary tails). The Lyα irradiance line center excites the atomic hydrogen present in the solar system by resonant scattering. The Lyβ irradiance line center populates by pumping an upper level of O i (through the O i 102.577 nm line). Then, by cascade, this over-populated level increases the intensity of other O i lines in both the solar atmosphere (Haisch et al. 1977) and comets (Feldman et al. 1976). Lyα and Lyβ solar radiances and irradiances are also important for the interpretation of the Lyα and Lyβ interplanetary glows observed, e.g., by Voyager 1 and 2 (Chassefiere et al. 1990).
Simultaneous high spectral resolution H i Lyα and Lyβ profiles (along with Mg ii h and k, and Ca ii H and K lines) on the solar disk have been obtained by the multichannel LPSP spectrometer on OSO8 (Bonnet et al. 1978) and used to create quiet and active region solar models (Gouttebroze et al. 1978; Lemaire et al. 1981). Near-simultaneous moderate-resolution lines on the solar disk have been recorded with the HCO spectrometers on both OSO-IV (Dupree & Reeves 1971) and SKYLAB (Vernazza & Reeves 1978).
High resolution Lyα and Lyβ profiles measured across the solar disk were published by Curdt et al. (2009) and Tian et al. (2009b). The Lyα/Lyβ line ratios obtained in these two papers were very high (130–200) and we reanalyze these data using another method to verify the ratio values.
Irradiance (full-disk) Lyα and Lyβ profiles were computed from data obtained with the multichannel OSO8/LPSP spectrometer (Lemaire et al. 1978) and calibrated with low resolution rocket measurements. Using the scattering properties of the SoHO/SUMER telescope, Lemaire et al. (2002) obtained high-resolution irradiance Lyα and Lyβ profiles. From 2002 to 2011, the TIMED/EGS-SEE spectrometer provided daily the Lyα and Lyβ irradiance profiles at moderate resolution within the 25 to 195 nm spectral coverage.
After a critical analysis of the Lyα to Lyβ radiance ratio obtained from OSO8/LPSP and SoHO/SUMER spectrometers we present in this letter the irradiance ratio for data acquired using the TIMED/EGS-SEE spectrometer.
2. Lyα to Lyβ radiance ratio
2.1. Results from the OSO8/LPSP spectrometer
The multichannel LPSP spectrometer on OSO8 obtained simultaneous line profiles in Lyα (resolution 2 pm), Lyβ (resolution 6 pm), Mg ii h and k, and Ca with a 1′′ × 10′′ typical slit (Bonnet et al. 1978). The shape of the Ca ii H and K profiles, combined with the telescope pointing, is used to discriminate between quiet and active area.
Here we analyze in greater detail the data sets in part used by Lemaire et al. (1981) to establish a plage model. The data sets were taken in quiet Sun (cell and network), active, and intermediate areas between June 28 and July 1, 1975. In the data sets we use here, the two O i lines (130.5 nm and 130.6 nm, 11th grating order) that polluted the Lyβ line wings (14th order), have already been removed.
The line ratios as a function of the Lyα radiance are displayed in Fig. 1. For the low Lyα energies, corresponding to the quiet Sun, the Lyα/Lyβ ratios are scattered around 76 (with σ ~ 10, σ being the variance square root). For high energies, active Sun or plage, the mean ratio is 66 (σ ~ 9). Using the data obtained from the OSO8/LPSP observation of prominences, Vial (1982) measured a ratio of 65. To obtain the Lyα/Lyβ ratio in photon units the ratio in energy units must be multiplied by 1.18.
2.2. Results from the SoHO/SUMER spectrometer
2.2.1. Observations and data analysis
We re-examine data obtained by SUMER on the solar disk in 2008 and 2009, that was previously analyzed in Curdt et al. (2009), and Tian et al. (2009a,b). The data were taken on July 2, 2008, starting at 19:36 (set1) at the disk center, on September 23, 2008, starting at 22:00 (set2) at the disk center and on April 17, 2009, starting at 16:01 (set3) at the southern polar coronal hole. As described in the above papers, prior to each observation, the entrance door of the telescope was partially closed to avoid detector saturation by the very bright Lyα line. Measurements of the door attenuation were performed before each observation in the Lyman continuum and very similar attenuation factors (f1) were obtained for the three dates (set1: 4.45; set2: 5.37; set3: 5.48). The Lyα line was recorded with the bare part of the detector B, while the Lyβ line was recorded with the KBr part to increase the sensitivity. Before each observation, the 4.4 nm wavelength extension of the full detector was recorded to verify the location of Lyα and, for the purposes of this work, the KBr to bare sensitivity factors (f2; set1: 7.5, set2: 7., set3: 6.5) were deduced.
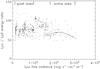 |
Fig. 1 Distribution of the Lyα/Lyβ energy ratio from the data obtained by the OSO8/LPSP (Lemaire et al. 1981) spectrometer. The dots are the line ratios, and the two solid lines are the least squares polynomial fits for the quiet and the active parts of the data. |
With the same entrance slit (0.3′′ × 120′′) and the same exposure time (15 s), each line was observed alternatively either in a time series (set1) or for each position of a raster (set2 and set3), so that the time delay (including the wavelength mechanism positioning lines) between the two (Lyα and Lyβ) profiles was approximatively 25 s and the repetition period was 50 s.
To reduce the data, we applied part of the standard procedure of the SUMER-soft library: local gain correction, dead-time correction, flat-field correction, and destretching. The Lyα absolute calibration was obtained in three stages:
-
first, we used the well-documented B-detector groundcalibration performed before launch (Hollandtet al. 1996) and verified at the beginning of themission (Schühle et al. 2000) (with thekeywords/BARE and /BEFORE in the radiometry procedure);
-
in data acquired after the 1998 SoHO “vacation”, we noted that SUMER experienced a continuous decline in sensitivity with time. To take this loss into account, the calibrations performed with the α Leo star (Lemaire 2002) were used and extrapolated to both 2008 and 2009 to determine the sensitivity loss factor f3 (set1: 1.80; set2: 1.85; set3: 1.90);
-
the final correction applied was that for the door partial aperture (f1).
The Lyα absolute radiance value is the result of the radiometry procedure multiplied by both the f1 and f3 factors.
To determine the Lyα/Lyβ line ratio, the sensitivity ratio of the KBr to the bare part of the detector at Lyα (f2) is introduced with the relative sensitivity ratio at the two wavelengths. This last ratio is derived from the 0.77 value obtained at the beginning of the mission (Schühle et al. 2000) by taking into account the differential sensitivity variation with time for f4 (set1: 1.25; set2: 1.26; set3: 1.27) extrapolated from α Leo star observations (Lemaire 2002).
2.2.2. Results
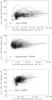 |
Fig. 2 Distribution of the Lyα/Lyβ energy ratio from the data obtained by SUMER at quiet Sun center a) and b) and across a polar coronal hole c), where the off-limb data are excluded). The dots represent the measurements. The continuous lines are the mean square polynomial fit for each set; they show the tendency for a slight increase in the ratio with increasing energy in Lyα. |
The distribution of the Lyα/Lyβ energy ratio as a function of the Lyα energy is displayed in Fig. 2 for the three data sets. There is a wide scatter in the data, which can be partly explained by the different temperature and physical conditions for the formation of the two lines. As the solar atmosphere is strongly inhomogeneous and structured in loops, the two lines are not formed in the same structure, and the actual ratio can be obtained only statistically (set1: 89 with σ ~ 19; set2: 91, σ ~ 13; set3: 71, σ ~ 10).
2.3. Radiance summary
The radiance data are summarized in Table 1. The quiet Sun observations (set1 and set2) provide Lyα/Lyβ ratios ~90, while a ratio of 71 is obtained with the set3 coronal hole observations. This result differes from the one obtained by Vernazza & Reeves (1978), where the coronal hole ratio of 90 is comparable to the quiet Sun ratio of 85.
Within the error bars, the quiet Sun results from the various authors are equivalent; there is more variation in the line ratios of the coronal holes. The significant spread in the active region results may be due to the saturation of the Lyα line in the ATM/HCO spectrometer data with more than 7 × 10⁵ counts s-1 on the detector. As mentioned by Vernazza and Reeves (1978), “the detection system exhibited a departure from linearity of less than 10% for counting rates up to 4 × 10⁵ counts s-1”. In any case, the active Lyα/Lyβ ratio is smaller than the quiet Sun ratio.
The SUMER results in this work differ significantly from the ones published by Curdt et al. (2009), and Tian et al. (2009a,b). The difference can be explained by our analysis including more effectively the α Leo measurements and taking into account the KBr-to-bare sensitivity variation in 2008 and 2009. This unexpected variation was not taken into account in previous works.
3. Lyα to Lyβ irradiance ratio
3.1. Previous results
A first compilation of previous irradiance data in the FUV range was provided by Donnelly & Pope (1973, with a low accuracy of up to a factor of two) for a moderate level of solar activity. This compilation was intended for use in modeling the ionosphere and the upper earth atmosphere (see Table 2).
The rocket launched to calibrate the OSO8/LPSP spectrometer on 1976 February 18 at minimum activity of solar cycle 20 provides the Lyα and Lyβ irradiance ratio (Lemaire et al. 1978, and Table 2)
3.2. Results from TIMED/EGS-SEE
3.2.1. Lyα and Lyβ profiles from SUMER and EGS-SEE
The Lyβ line as seen with the EGS-SEE 0.4 nm spectral resolution (Woods et al. 1998, 2005) includes two weak lines (O i 102.5 nm and O i 102.6 nm) resolved with the 0.044 nm SUMER resolution. To determine the contribution of these two weak lines to the EGS-SEE profile, we compare SEE and SUMER observations taken on the same day (September 20, 2008).
The SUMER observation was made off-limb (1700 arcsec from disk center). Using the properties of the telescope scattered-light to average the solar features (Lemaire et al. 2002), a full Sun profile is obtained. This profile is then convolved with the EGS instrumental function (computed from instrumental data given in Woods et al. 1998) and compared to the EGS Lyβ profile1. The original Lyβ profile, the convolved profile, and the EGS profile are displayed in Fig. 3, where each profile is normalized to its maximum value. We conclude that the contribution of the two O i lines is less than 5% in the EGS-SEE signal.
Lyα/Lyβ radiance energy ratio.
Lyα/Lyβ irradiance energy ratio during a solar activity cycle.
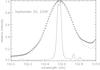 |
Fig. 3 Lyβ profiles: the SUMER profile (solid line), the SUMER profile convolved with the EGS instrumental function (crosses) and the EGS data (dashed line). Each curve has been normalized to its maximum value. |
3.2.2. Lyα/Lyβ ratio from TIMED/EGS-SEE
Using a small subset of the data obtained by EGS-SEE during 2002–20102, nearly covering half of solar cycle 23 and the beginning of solar cycle 24, we established the variation in the Lyα/Lyβ irradiance ratio as a function of the Lyα irradiance (Fig. 4). The Lyα and the Lyβ irradiances are respectively taken over 1 nm and 0.7 nm intervals. A computed least squares fit with a third order polynomial is also shown and the energy equation can be written
 where w are the coefficients (511., –163.5, 19.70, and –0.796) and σ are the errors attached to each coefficient (54., 22.1 , 2.92, and 0.126); where Lya is in mW m-2.
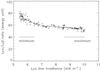 |
Fig. 4 Variation in the Lyα/Lyβ irradiance ratio versus the Lyα irradiance from a subset of EGS-SEE measurements taken in the 2002–2010 year range (crosses represent the observation and the solid line is a least squares polynomial fit). For comparison purposes, we also show the result of a rocket flight, obtained in February 18, 1978 to calibrate the OSO8/LPSP spectrometer (Lemaire et al. 1978), as a large, unfilled circle. |
A similar equation is obtained to fit the data given in photons:
 where p are the coefficients (603., –315.2, 62.05, and –4.093) and σ are the errors attached to each coefficient (64., 42.6, 9.21 and 0.651); Lya is in 1 × 10¹⁵ Phot s-1 m-2.
The accuracy of irradiance measurements in Lyα is 26%3. To permit a comparison, the measurement done by OSO8/LPSP (Lemaire 1978) during the minimum between solar cycles 20 and 21 (year 1976) is included into Fig. 4 (big circle), and is within the scatter of the very quiet Sun data obtained by the EGS-SEE spectrometer.
As seen in Fig. 4, while the quiet Sun ratio (in energy) is about 80, the active Sun ratio is near 65. The Lyα/Lyβ irradiance ratio significantly decreases with solar activity. The irradiance results are summarized in Table 2.
4. Conclusion
On the solar disk (radiance), the average quiet Sun H i Lyα to Lyβ line energy ratio is between 76 and 90 with a scatter
greater than 50%. It decreases to 35–66 with the same scatter in active regions.
At minimum activity, the average H i Lyα to Lyβ line irradiance energy ratio is 70 with a small scatter (3σ ~ 25%) around this value. At activity maximum, this ratio decreases to 55 with a small scatter (3σ ~ 22%).
The Lyα to Lyβ line radiance ratio (Fig. 2) increases with Lyα energy, while the irradiance ratio (Fig. 4) decreases with Lyα energy. Further analysis of this ratio in active regions is needed to understand the irradiance results.
Using a sampling of the TIMED/EGS-SEE data obtained during the years 2002–1010 (spanning from the maximum of solar cycle 23 to the beginning of solar cycle 24), we established a relation between the Lyα and Lyβ line irradiances (in terms of both energy and photons) that is helpful in estimating the Lyβ irradiance when only the Lyα irradiance is known.
File see__egs_L2_2008264_010_02.ncdf.
See__egs_L2_20*.ncdf files.
From data.ERR_TOT file in see__egs_L2..file.
Acknowledgments
The building, calibration, and operation of the LPSP multichannel spectrometer was funded under several CNES contracts (from 1970 to 1977). The LPSP instrument was part of the OSO8/NASA program. The SUMER project is financially supported by DLR, CNES, NASA, and the ESA PRODEX program (Swiss contribution). SUMER is part of SOHO of ESA and NASA. EGS-SEE is part of the TIMED/NASA program and is supported at University of Colorado by NASA grant NNX07AB68G. The authors thank the referee for his corrections and comments.
References
- Bonnet, R. M., Lemaire, P., Vial, J.-C., et al. 1978, ApJ, 221, 1032 [NASA ADS] [CrossRef] [Google Scholar]
- Chassefiere, E., Lallement, R., Bertaux, J. L., Vial, J.-C., & Sandel, B. R. 1990, in Physics of the Outer Heliosphere, Cospar Coll. Ser., 1, ed. S. Grzedzielski, & D. E. Page (New York: Pergamon), 65 [Google Scholar]
- Curdt, W., Tian, H., Teriaca, L., Schühle, U., & Lemaire, P. 2009, A&A, 492, L9 [Google Scholar]
- Donnelly, R. F., & Pope, J. H. 1973, NOAA Technical Report ERL 276-SEL 25 [Google Scholar]
- Dupree, A. K., & Reeves, E. M. 1971, ApJ, 165, 599 [NASA ADS] [CrossRef] [Google Scholar]
- Feldman, P. D., Opal, C. B., Meier, R. R., & Nicolas, K. R. 1976, NASA SP-393, 773 [Google Scholar]
- Gouttebroze, P., Lemaire, P., Vial, J.-C., & Artzner, G. 1978, ApJ, 225, 655 [NASA ADS] [CrossRef] [Google Scholar]
- Haisch, B. M., Linsky, J. L., Weinstein, A., & Shine, R. A. 1977, ApJ, 214, 785 [NASA ADS] [CrossRef] [Google Scholar]
- Hollandt, J., Schühle, U., Paustian, W., et al. 1996, Appl. Opt., 35, 5125 [NASA ADS] [CrossRef] [Google Scholar]
- Lemaire, P. 2002, in The Radiometric Calibration of SOHO, ed. A. Pauluhn, M. C. Huber, & R. von Steiger, Bern, ISSI SR-002, 265 [Google Scholar]
- Lemaire, P., Charra, J., Jouchoux, A., et al. 1978, ApJ, 223, L55 [NASA ADS] [CrossRef] [Google Scholar]
- Lemaire, P., Gouttebroze, P., Vial, J.-C., & Artzner, G. E. 1981, A&A, 103, 160 [NASA ADS] [Google Scholar]
- Lemaire, P., Emerich, C., Vial, J.-C., et al. 2002, in Proc. SOHO 11, From Solar Min to Max: Half a Solar Cycle with SOHO, ed. A. Wilson, ESA SP, 508, 219 [Google Scholar]
- Schühle, U., Curdt, W., Hollandt, J., et al. 2000, Appl. Opt., 39, 418 [NASA ADS] [CrossRef] [Google Scholar]
- Tian, H., Teriaca, L., Curdt, W., & Vial, J.-C. 2009a, ApJ, 703, L152 [NASA ADS] [CrossRef] [Google Scholar]
- Tian, H., Curdt, W., Marsch, E., & Schühle, U. 2009b, A&A, 504, 239 [NASA ADS] [CrossRef] [EDP Sciences] [Google Scholar]
- Vernazza, J. E., & Reeves, E. M. 1978, ApJS, 37, 485 [NASA ADS] [CrossRef] [Google Scholar]
- Vernazza, J. E., Avrett, E. H., & Loeser, R. 1981, ApJS, 45, 635 [NASA ADS] [CrossRef] [Google Scholar]
- Vial, J.-C. 1982, ApJ, 253, 330 [NASA ADS] [CrossRef] [Google Scholar]
- Wilhelm, K., Curdt, W., Marsch, E., et al. 1995, Sol. Phys., 162, 189 [NASA ADS] [CrossRef] [Google Scholar]
- Wilhelm, K., Lemaire, P., Curdt, W., et al. 1997, Sol. Phys., 170, 75 [NASA ADS] [CrossRef] [Google Scholar]
- Woods, T. N., Bailey, S. M., Eparvier, F. G., et al. 1998, in Missions to the Sun II, ed. C. M. Korendyke, Proc. SPIE, 3442, 180 [Google Scholar]
- Woods, T. N., Eparvier, F. G., Bailey, S.M., et al. 2005, J. Geophys. Res., 110, A01312 [NASA ADS] [CrossRef] [Google Scholar]
All Tables
All Figures
|
Fig. 1 Distribution of the Lyα/Lyβ energy ratio from the data obtained by the OSO8/LPSP (Lemaire et al. 1981) spectrometer. The dots are the line ratios, and the two solid lines are the least squares polynomial fits for the quiet and the active parts of the data. |
| In the text | |
|
Fig. 2 Distribution of the Lyα/Lyβ energy ratio from the data obtained by SUMER at quiet Sun center a) and b) and across a polar coronal hole c), where the off-limb data are excluded). The dots represent the measurements. The continuous lines are the mean square polynomial fit for each set; they show the tendency for a slight increase in the ratio with increasing energy in Lyα. |
| In the text | |
|
Fig. 3 Lyβ profiles: the SUMER profile (solid line), the SUMER profile convolved with the EGS instrumental function (crosses) and the EGS data (dashed line). Each curve has been normalized to its maximum value. |
| In the text | |
|
Fig. 4 Variation in the Lyα/Lyβ irradiance ratio versus the Lyα irradiance from a subset of EGS-SEE measurements taken in the 2002–2010 year range (crosses represent the observation and the solid line is a least squares polynomial fit). For comparison purposes, we also show the result of a rocket flight, obtained in February 18, 1978 to calibrate the OSO8/LPSP spectrometer (Lemaire et al. 1978), as a large, unfilled circle. |
| In the text | |
Current usage metrics show cumulative count of Article Views (full-text article views including HTML views, PDF and ePub downloads, according to the available data) and Abstracts Views on Vision4Press platform.
Data correspond to usage on the plateform after 2015. The current usage metrics is available 48-96 hours after online publication and is updated daily on week days.
Initial download of the metrics may take a while.