Free Access
Fig. 1
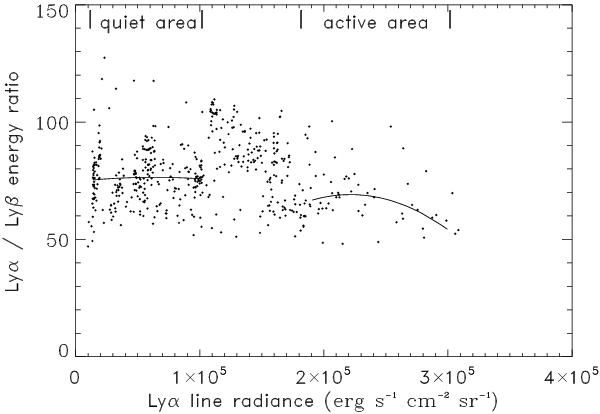
Distribution of the Lyα/Lyβ energy ratio from the data obtained by the OSO8/LPSP (Lemaire et al. 1981) spectrometer. The dots are the line ratios, and the two solid lines are the least squares polynomial fits for the quiet and the active parts of the data.
Current usage metrics show cumulative count of Article Views (full-text article views including HTML views, PDF and ePub downloads, according to the available data) and Abstracts Views on Vision4Press platform.
Data correspond to usage on the plateform after 2015. The current usage metrics is available 48-96 hours after online publication and is updated daily on week days.
Initial download of the metrics may take a while.