Fig. 9
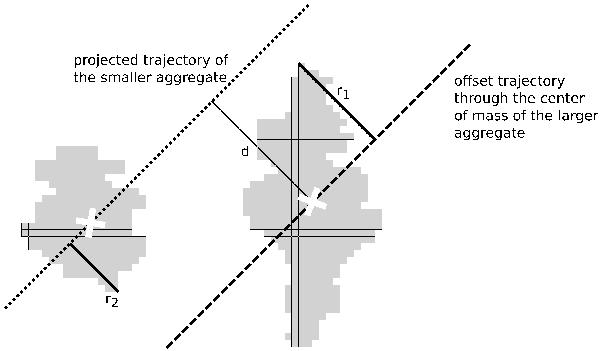
Visualization of the components used for the impact parameter calculation, where r1, r2 and d are determined on the last frame before the aggregates get in touch. The dotted line represents the momentary projected trajectory of the smaller aggregate relative to the center of mass of the larger aggregate (white cross). The offset trajectory through the center of mass of the larger aggregate is marked with a dashed line. The distance d between the center of mass of the larger aggregate and the momentary projected trajectory of the smaller aggregate is visualized with a thin line.
Current usage metrics show cumulative count of Article Views (full-text article views including HTML views, PDF and ePub downloads, according to the available data) and Abstracts Views on Vision4Press platform.
Data correspond to usage on the plateform after 2015. The current usage metrics is available 48-96 hours after online publication and is updated daily on week days.
Initial download of the metrics may take a while.