Free Access
Fig. 8
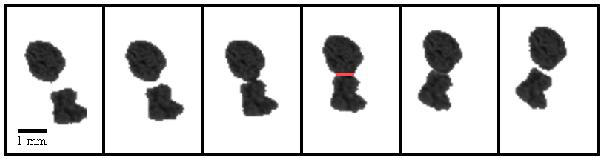
Example of a collision between two aggregates with a time step of ~8 ms from the left to the right. The red line corresponds to the maximum contact line lc.
Current usage metrics show cumulative count of Article Views (full-text article views including HTML views, PDF and ePub downloads, according to the available data) and Abstracts Views on Vision4Press platform.
Data correspond to usage on the plateform after 2015. The current usage metrics is available 48-96 hours after online publication and is updated daily on week days.
Initial download of the metrics may take a while.