Fig. 2
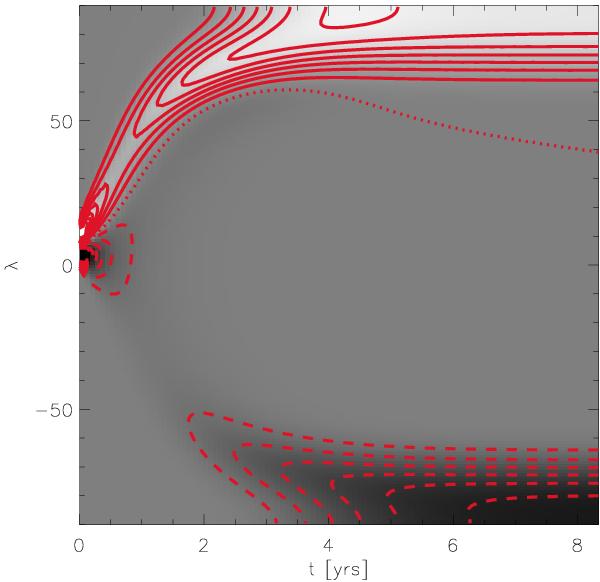
Evolution of the azimuthally averaged signed field strength from the SFT simulation, with black and white representing opposite polarities saturated at 36% of the initial azimuthally averaged field strength. The solid and dashed red contours indicate where the field strength reaches ± 5%, ± 10%, etc. of its maximum value, with the dotted curve representing the 0 level.
Current usage metrics show cumulative count of Article Views (full-text article views including HTML views, PDF and ePub downloads, according to the available data) and Abstracts Views on Vision4Press platform.
Data correspond to usage on the plateform after 2015. The current usage metrics is available 48-96 hours after online publication and is updated daily on week days.
Initial download of the metrics may take a while.