Fig. 5
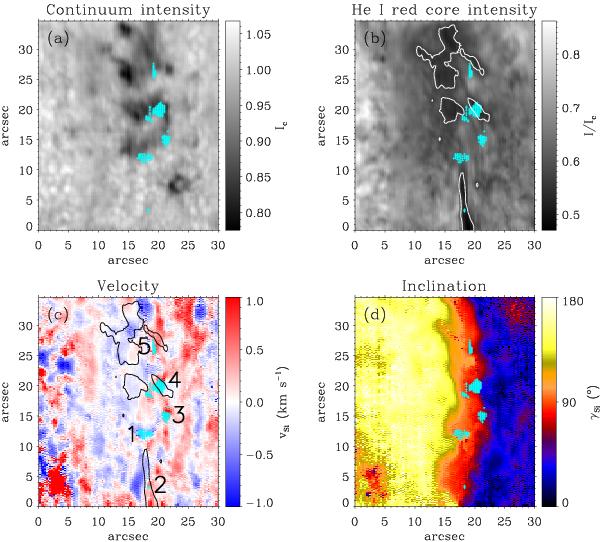
a) The continuum intensity image show pores and orphan penumbrae at the PIL. b) The absorption in helium (red core) clearly shows the spine in the lower part of the image and a diffuse filament in the upper part. c) LOS velocity map inferred from the standard single-component inversions of SIR. The marked areas (1 − 5) correspond to the two-component Stokes V profiles (the average inclinations and velocities for these areas are presented in Table 4). d) LOS inclinations from the single-component inversions. In all maps, the cyan colored crosses mark the positions where two-component profiles were detected.
Current usage metrics show cumulative count of Article Views (full-text article views including HTML views, PDF and ePub downloads, according to the available data) and Abstracts Views on Vision4Press platform.
Data correspond to usage on the plateform after 2015. The current usage metrics is available 48-96 hours after online publication and is updated daily on week days.
Initial download of the metrics may take a while.