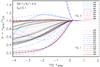
Fig. 9
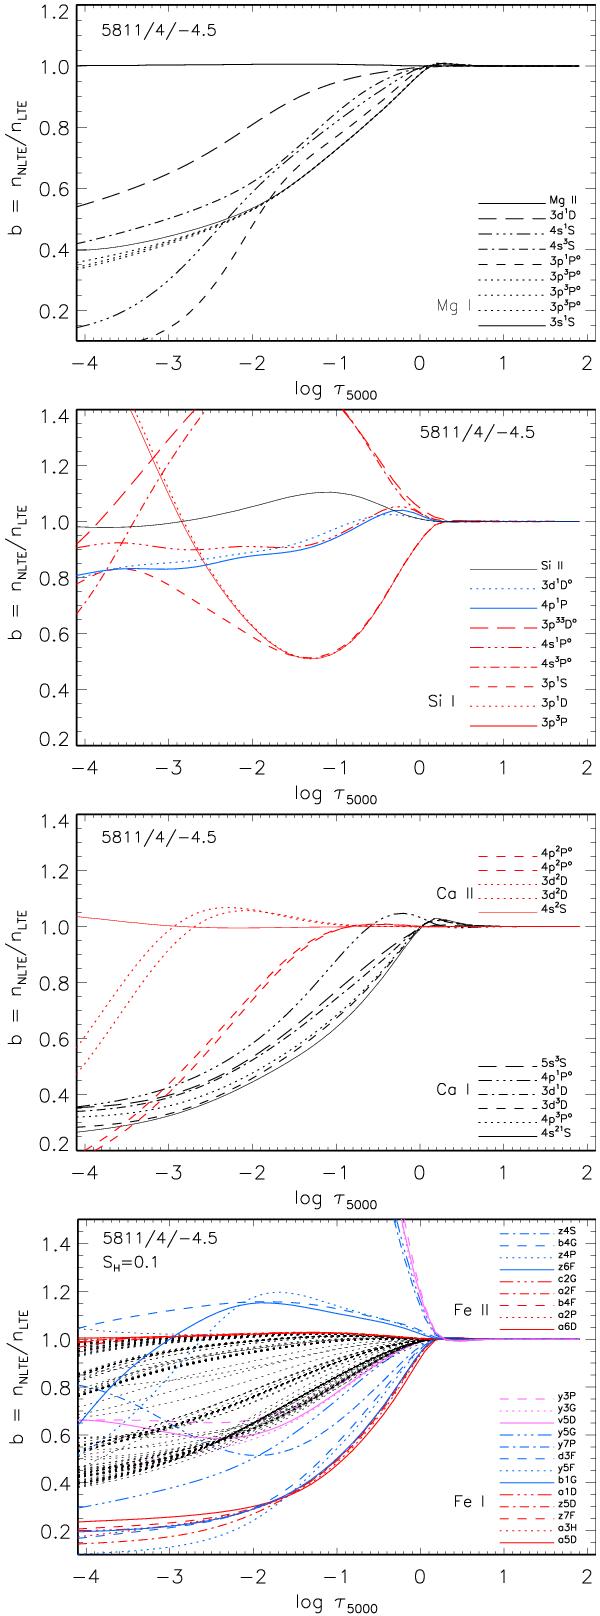
Departure coefficients b, for the selected levels of the investigated atoms as a function of log τ5000 in the model atmosphere 5811/4.0/−4.5. Bottom panel: we show every fifth of the first 60 levels for Fe i. They are quoted in the bottom-right part of the panel. All remaining higher levels of Fe i are plotted by dotted curves. We show the same for Fe ii. They are quoted in the top-right part of the panel. SH = 0.1 throughout.
Current usage metrics show cumulative count of Article Views (full-text article views including HTML views, PDF and ePub downloads, according to the available data) and Abstracts Views on Vision4Press platform.
Data correspond to usage on the plateform after 2015. The current usage metrics is available 48-96 hours after online publication and is updated daily on week days.
Initial download of the metrics may take a while.