| Issue |
A&A
Volume 542, June 2012
|
|
|---|---|---|
| Article Number | A61 | |
| Number of page(s) | 7 | |
| Section | Galactic structure, stellar clusters and populations | |
| DOI | https://doi.org/10.1051/0004-6361/201118442 | |
| Published online | 07 June 2012 | |
Leo IV and V – A possible dwarf galaxy pair?
Departamento de Astronomía, Universidad de Concepción, Casilla 160-C, Concepción, Chile
e-mail: mblana@udec.cl
Received: 11 November 2011
Accepted: 30 March 2012
The last few years have seen the discovery of many faint and ultra-faint dwarf spheroidal galaxies around the Milky Way. Among these is a pair of satellites called Leo IV and Leo V. This pair is found at large distances from the Milky Way (154 and 175 kpc, respectively). The fairly small difference in radial distance, and the fact that they also show a close projected distance on the sky, has led to the idea that we might be seeing a new pair of bound galaxies – like the Magellanic Clouds. In this paper we investigate this speculation by means of a simple integration code (confirming the results with full N-body simulations). Because the luminous mass of the two faint dwarfs is far too low to allow them to be bound, we simulate the pair assuming extended dark matter haloes. Our results show that the minimum dark matter mass required for the pair to be bound is quite high – ranging from 1.6 × 10¹⁰ M⊙ to 5.4 × 10¹⁰ M⊙ (within the virial radii). Computing the mass of dark matter within a commonly adopted radius of 300 pc shows that our models are well within the predicted range of dark matter content for satellites so faint. We therefore conclude that it could be possible that the two galaxies constitute a bound pair.
Key words: galaxies: dwarf / galaxies: individual: Leo IV / galaxies: halos / methods: numerical / galaxies: individual: Leo V
© ESO, 2012
1. Introduction
The last decade has seen the discovery of many new faint dwarf spheroidal (dSph) galaxies of the Milky Way (MW) (e.g. Willman et al. 2005; Belokurov et al. 2006; Zucker et al. 2006a; Belokurov et al. 2007; Walsh et al. 2007, and many more). Many of these dwarfs are less luminous than a globular cluster (or even an open cluster) and exhibit high velocity dispersions (given their luminous mass) (e.g. Simon & Geha 2007; Koch et al. 2009; Geha et al. 2009). Should these objects be in virial equilibrium, they are the most dark matter (DM) dominated objects known in the universe. They would exhibit mass-to-light (M/L) ratios of more than a thousand (e.g. Simon & Geha 2007; Fellhauer et al. 2008; Geha et al. 2009).
ΛCDM simulations (e.g. the Millennium II simulation of Boylan-Kolchin et al. 2009, or the Via Lactea INCITE simulation of Kuhlen et al. 2008) predict that a galaxy like our MW should be surrounded by hundreds, if not thousands of small DM haloes that could host a dwarf galaxy. The discrepancy between the known number of MW satellites and these predicted values is known as the “missing satellite problem” (e.g. Klypin et al. 1999; Moore et al. 1999). The discovery of new faint dwarfs in the SDSS catalogue doubled the number of known satellites. Extrapolating to areas of the sky and distances not covered by the survey (e.g. Koposov et al. 2008; Macciò et al. 2009, 2010) may suggest that the missing satellite problem is now solved.
Amongst these ultra-faint galaxies are dwarfs that are extremely metal-poor (Kirby et al. 2008, and references therein), some show complex star formation histories (Leo T de Jong et al. 2008) and many of them show unusual morphologies (Coleman et al. 2007; Sand et al. 2009). Others seem to show signs of tidal disruption (Zucker et al. 2006b; Fellhauer et al. 2007; Muñoz et al. 2008).
Signs of tidal disruption and the fact that all known dwarfs seem to be aligned in a disc-like structure around the MW (e.g. Metz et al. 2008, 2009) has given rise to alternative explanations for the existence of those galaxies. These theories imply that most, if not all, of the MW dwarfs are in fact no more than disrupting star clusters or tidal dwarf galaxies hosting no DM at all (Pawlowski et al. 2011).
In this paper we focus on two of these new ultra-faint dwarfs, namely Leo IV (Belokurov et al. 2007) and Leo V (Belokurov et al. 2008). Their properties have been studied by many authors: for Leo IV e.g. Moretti et al. (2009); Simon et al. (2010); Sand et al. (2010) and for Leo V e.g. Walker et al. (2009a,b). We summarize a selection of the observational data in Table 1. The pair of galaxies is found at a rather large distance from the MW (154 and 175 kpc, respectively). The two galaxies are not only very close to each other in radial distance (22 kpc) (Moretti et al. 2009; de Jong et al. 2010) but also in projected distance on the sky. Their radial velocity differs only by about 50 km s-1. In the discovery paper of Leo V the authors speculate that the two dwarfs could be a bound pair similar to the Magellanic Clouds. In particular, the smaller dwarf, Leo V, exhibits deformed elongated contours (Walker et al. 2009a), which could be signs of tidal interaction. Furthermore, there is a tentative stellar bridge between the two satellites (de Jong et al. 2010), which now is more likely a foreground stream of the Virgo overdensity (Jin et al. 2012). de Jong et al. (2010) argued that to form a bound object, the twin system would need a lot of DM – much more than is seen in similar faint satellites. Nevertheless, the authors claimed that it is highly unlikely that the two satellites are a simple by-chance alignment. The authors also rule out the possibility that the two faint dwarfs are not galaxies at all but simple density enhancements of a stellar stream by orbital arguments. They conclude that the two dwarfs might be a “tumbling pair” of galaxies that have fallen into the MW together.
We aim to investigate the hypothesis of a bound pair in more detail. Using a simple two-body integration method we investigate a large part of the possible parameter space, searching for the minimum total mass that the system needs to form a tightly bound pair. We assume that both galaxies have their own DM halo, orbiting each other. We describe the setup of our simulations in the next section. We then report and verify (using full N-body simulations) our results in Sect. 3 and finally discuss our findings in Sect. 4.
2. Setup
2.1. Parameter space
Observational properties of Leo IV and Leo V.
We use the positions and distances as reported in the discovery papers of Belokurov et al. (2007, 2008). This enables us to transform the positions into a Cartesian coordinate system. The coordinates for Leo IV and Leo V are shown in the first three lines in Table 2.
Current observations only provide radial velocities for the pair. Nothing is known so far about their proper motions. We therefore adopt two velocity cases in our simulations. First, we investigate a scenario where the radial velocity is the only velocity component of the galaxies (lines 4–6 in Table 2) and second, we adopt an outward tangential velocity of the same magnitude as the radial velocity (lines 7–9 in Table 2). Here “outward tangential” means that the velocity vector is perpendicular to the radial velocity and points away from the other dwarf. This choice could be regarded as the worst case scenario. With these assumptions we restrict the possible parameter space of initial conditions significantly, but we are able to deduce the strength of the influence of a tentative tangential velocity on our results.
To restrict our parameter space even more we adopt just two cases for the mass-ratio between the two satellites. The observed absolute magnitudes give a luminosity ratio of 1.8. Adopting a mass-follows-light scenario for one of our cases, we use the same ratio for the two DM haloes: 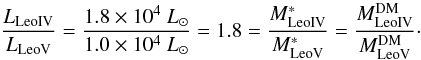 (1)Walker et al. (2009b) suggest that the faint and ultra-faint dwarfs reside in similar DM haloes of a certain minimum mass. Therefore, we investigate equal mass DM haloes as the other case.
Initial positions and velocities in the adopted Cartesian coordinate system.
For the four cases described above we search for solutions adopting halo concentrations of c = 5, 10, and 20 because those are values typically adopted for dwarf galaxies (Lokas & Mamon 2001). This gives a total of 12 different solutions to the problem.
The haloes are described as NFW-profiles with c = rvir / rscale, rvir = r200 being the virial radius in which the density is 200 times the critical density of the universe, using a standard value of the Hubble constant of H0 = 70 km s-1 Mpc-1.
Minimum bound mass for each of our cases.
2.2. Method
de Jong et al. (2010) investigated the minimum mass for the two DM haloes of the satellites by assuming they were point masses. We use a simple two-body integration programme modelling the system in the following way:
-
The two satellites are represented by analytical, rigid Navarroet al. (1997, potentials. Theforce on the centre of mass of one halo is computed using the exactforce according to its position with respect to the potential of theother halo.
-
To make them a tightly bound pair we adopt a rigid distance criterion that requires that neither centre of the two haloes leaves the halo of the other dwarf, i.e. their separation is always smaller than the virial radius of the (smaller) halo.
-
For each case we choose the total mass of the system and set up the two haloes according to their mass-ratio and concentration. Then we run the two-body code to determine if our distance criterion is fulfilled. If the maximum distance turns out to be larger or smaller, we alter the the total mass respectively and use the code again. We iterate this process until we find a maximum separation equal to our distance criterion.
The reason why we choose a distance criterion instead of computing the escape velocity (i.e. the velocity the two dwarfs need to separate from each other to infinity) is that if we were to adopt such a criterion, we would also include bound cases in which the maximum separation between the two dwarfs easily exceeds their distance to the MW. Because this would not make sense, we exclude these solutions by imposing a very rigid distance criterion.
Furthermore, an estimation of the tidal radii of Leo IV and V yields values that are similar to our distance criterion. Using 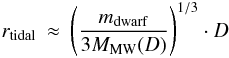 (2)with mdwarf ≈ 4 × 10¹⁰ M⊙, MMW(D) ≈ 1012 M⊙ and D ≈ 165 kpc, we obtain 40 kpc for the tidal radius. This is slightly lower than the distance criterion, but is also a quite rough estimate. However, it shows that the distance criterion is a sensible way to restrict the solutions.
Hence, the choice of our distance criterion allows us to treat the galaxy pair as isolated, i.e. to neglect the potential of the MW.
The simulations are always computed forward in time, starting from our current view of the dwarfs. We thus ascertain the next maximum separation to assess if the two dwarfs are bound to each other now. Because we do not know where they came from, or the details of their orbit around the MW, we cannot predict their future fate using these models.
2.3. Full N-body simulations
To ensure that the results are reasonable, we perform full N-body simulations as a check of each of the 12 solutions obtained with our simple code. We use the particle-mesh code Superbox (Fellhauer et al. 2000). It is fast and enables simulations of galaxies on normal desktop computers. It has two levels of higher resolution grids, which stay focused on the simulated objects, providing high resolution only in the areas where it is needed.
Each object (halo) is modelled using 1 000 000 particles. We use NFW distributions for the haloes according to the results obtained with the two-body code. The haloes extend all the way to their virial radius.
The resolution of the grids is such that we try to keep about 15 cell-lengths per scale length, rsc, of the haloes. A particle-mesh code has no softening-length like a tree-code but previous studies (Spinnato et al. 2003) showed that the length of one grid-cell is approximately the equivalent of the softening-length. Furthermore, the particles in a particle-mesh code are not stars or in our case DM-particles, they instead represent tracer-particles of the phase-space of the simulated object. Densities are derived on a grid, and then a smoothed potential is calculated. The number of particles is chosen according to the adopted grid-resolution to ensure smooth density distributions. A detailed discussion about the particle-mesh code Superbox can be found in Fellhauer et al. (2000).
We recall for clarity that the N-body simulations are only used to verify the results of the simple method. This means we check the next maximum distance of the two galaxies. The simulations do not represent full-scale simulations of the past, present, and future of the two Leo galaxies. Such simulations are more demanding and are beyond the simple scope of this paper.
3. Results
3.1. Point mass case
We first recalculate the minimum bound mass assuming both galaxies are point masses, following the methodology by de Jong et al. (2010). We assume that the relative velocity between the two dwarfs is equal to their escape velocity (i.e. the velocity required for the haloes to separate to infinity). Because point masses do not have any characteristic radius we cannot apply any meaningful distance criterion here.
Using only the observed radial velocities (case 0a) we confirm the total DM mass of the system obtained by de Jong et al. (2010). Our result is a factor of two lower, however, those authors used an approximation obtained from energy arguments, while we perform the full escape velocity calculation. Given the wide range in possible results, as shown below, and taking the observational uncertainties into account, a difference of a factor of two is still a very good match.
Furthermore, we calculate the minimum bound mass assuming the two satellites also have tangential velocities (according to Table 2). In this case (case 0b) the total mass required to keep the galaxies bound is 1.47 × 10¹⁰ M⊙. That is, three times more DM is required to keep them bound. While this may seem a large mass, we refer the reader to the following sections to put this result into context.
The results are shown in Table 3 in the first two lines and in Fig. 1 at 1 / c = 0.
3.2. Two-body integrator
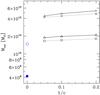 |
Fig. 1 Minimum DM mass of the total system Mtot versus concentration of the haloes. We plot 1 / c in favour of c to include the point-mass results at 1 / c = 0 (cases 0a, b; plotted as open and filled circle – blue online). Solid lines are the results using the mass-ratio of 1.8. Triangles are cases with radial velocity only and tri-stars with additional tangential velocity. Dashed lines show the results of equal mass haloes. Squares are radial-velocity-only cases and crosses have additional tangential velocity. |
We now turn to the results, obtained with the two-body integrator. As explained in Sect. 2, the two haloes are rigid, analytical potentials acting on the centre of mass of the other galaxy. Additionally, we now introduce a very strict distance criterion of the form that neither halo centre should leave the other halo (i.e. separations larger than the (smaller) virial radius). This way we make sure that we are really dealing with a tightly bound pair.
The results are two-fold: Of course we see an immediate strong increase in the required minimum mass (compared to the point-mass cases) just by introducing the rigid distance criterion. We plot the total mass in DM against 1 / c in Fig. 1 to include the point mass cases (c = ∞). We see that the bound mass is larger for lower values of the concentration. This can be easily understood because with higher concentrations we have more of the total mass of the halo concentrated towards the centre and therefore the gravitational pull on the other dwarf is stronger.
Secondly, we also find that including the additional tangential velocity roughly triples the required mass. While the cases with radial velocities (cases 1–3, 1a–3a) require masses in the range of about 1.6−2.1 × 10¹⁰ M⊙, the additional tangential velocity increases the necessary masses up to much higher values of 4.2−5.4 × 10¹⁰ M⊙ (cases 4–6, 4a–6a).
In passing we remark that we need slightly less massive haloes in the equal-halo-mass cases than if we adopt a mass-ratio of 1.8 between the two haloes. Because these differences are small compared with the differences of the unknown concentration, and even more so with the unknown tangential velocity, we can easily neglect them and assume that distributing the mass differently between the two haloes has no strong effect on our results.
The possible range of DM masses for the two galaxies spans about half an order of magnitude. However, given the large observational uncertainties it is the best we can do. The masses themselves are fairly large and taken at face value would imply that the two dwarfs are among the most DM-dominated objects in the observed universe.
3.3. Comparison with observationally obtained data
Mass-range of the haloes of cases 1a–3a and 4a–6a (which encompass the range of our results) within a radius of Leo IV of 97 pc, for which an observationally based estimate of the mass exists (Simon & Geha 2007).
We now put our results into context and compare them with observations. Simon & Geha (2007) measured the velocity dispersion of Leo IV and derived a total dynamical mass, within their optical radius (97 pc), of 1.4 ± 1.5 × 10⁶ M⊙. This implies an M/L-ratio of 151. This value is quite similar to most of the other known dSph galaxies of the MW. We therefore use our results and compute the mass of our Leo IV haloes within the same 97 pc. The resulting masses and derived M/L-ratios are shown in Table 4. Our M/L-ratios are in the range of 35–328 and encompass the results of Simon & Geha (2007). Furthermore, should the results of Simon & Geha (2007), which are based on very few stars, prove to be correct, our results mean that we can rule out DM haloes with high concentrations (i.e. c = 20).
Walker et al. (2009a) report a central velocity
dispersion of  km s-1 based on five stars for Leo V. Using
this value they calculate a dynamical mass, within an adopted
rh = 67.4 pc, of
km s-1 based on five stars for Leo V. Using
this value they calculate a dynamical mass, within an adopted
rh = 67.4 pc, of  . Calculating the mass within this radius in our models
gives a range from 2.7 × 10⁵ M⊙ to
2.5 × 10⁶ M⊙, again encompassing the results
derived from observations by Walker et al. (2009a).
. Calculating the mass within this radius in our models
gives a range from 2.7 × 10⁵ M⊙ to
2.5 × 10⁶ M⊙, again encompassing the results
derived from observations by Walker et al. (2009a).
Another way to compare our results with observations is by computing the total mass within a “standard” radius of 300 pc, as adopted by Walker et al. (2009b). We can then infer the M/L-ratio inside this radius and compare our results with the observationally derived results reported by Wilkinson et al. (2006). Given the low luminous masses of the two dwarfs, our results point to M/L-ratios in the order of log 10(M / L) = 2.5−3.7 (see also Table 5). Despite being quite high, plotting these values together with observationally derived values of other dwarfs (Fig. 2) we see that they follow the general trend of higher M/L-ratios with lower luminous masses. Indeed, if we fit a line through the observational results, our values would intersect that linear fit.
This means that not only do our results follow and confirm the observed trend of the known MW dSphs, we can furthermore conclude that the two satellites do not need unreasonable amounts of DM to form a bound pair.
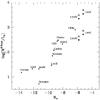 |
Fig. 2 Mass-to-light ratios within a radius of 300 pc. The circles are the dSph galaxies of the Local Group as reported by Wilkinson et al. (2006). For Leo IV, the filled upside-down triangles are cases 1a and 3 (concentrations c = 5 and c = 20 respectively) with radial velocities only. The open triangles are cases 4a and 6 (c = 5 and c = 20) with radial and tangential velocities. For Leo V we plot the values of cases 1 and 3a as well as 4 and 6a, respectively. We use these specific cases because they span the whole range of our results. |
3.4. Comparison to N-body simulations
Mass-to-light ratios within a radius of 300 pc of our simulations.
Since we now have the results of all our cases, we have to make sure that they still hold if we resimulate them with a full N-body code. Of course the full N-body simulations will differ significantly from those above, we simply want to know if our conclusions remain valid.
In the full N-body simulations, the two live haloes are interacting with each other. They experience dynamical friction, which shrinks their orbits around each other until they finally merge. This cannot be reproduced by the simple code, but we can determine if the next maximum separation of the orbit is smaller than the extent of the other halo, as our distance criterion in the simple simulations requires.
What we find is that the results differ by a few per cent (max. 6.5%) in the simulations using a mass ratio of 1.8 between the haloes. The haloes are slowed down and, therefore, turn around at a smaller separation.
If the haloes have the same mass and we only adopt radial velocities, the orbit overshoots the maximum distance by approximately 20 per cent. If we add the additional tangential velocities, our restricted results differ by about 28–45 per cent, in the sense that the maximum separation is larger in the “full” simulation than in the restricted one. This may seem odd given that dynamical friction should act in the opposite direction, however, there are other mechanisms at work. We see an expansion of the haloes as orbital energy is transformed into internal energy, furthermore, we see that the two haloes become deformed – particles from one halo are dragged along by the gravitational force of the other. We give the ratio of the maximum separations between the full and restricted simulations in the second-to-last column of Table 3 (labelled “ratio”).
We plot in Fig. 3 the results of case 4a, the case with the largest discrepancy in separation between the two haloes compared with the restricted prediction. In the left panel we see the contours of the Leo V halo at the time of maximum separation, with the cross marking the position of the centre of Leo IV. We see that the contours are slightly elongated towards the other halo and that they show a clear deformation. This deformation is caused by the gravitational pull of the other halo, which has dragged particles of the dwarf towards it.
In the middle panel we see the large discrepancy between the distance criterion (horizontal line) and the actual first maximum separation of the orbit. But because the total mass of an NFW profile only increases with the logarithm of the radius, even a large discrepancy in radius as in our case 4a only amounts to a few per cent error in the mass of the halo. Given the fact that our results span almost an order of magnitude, and the large uncertainties from the observations (luminous mass, distance, etc.), we claim that the results of the restricted code are verified.
Finally, the right panel of Fig. 3 shows the Lagrangian radii of Leo IV (solid lines) and Leo V (dashed lines). We see that the interaction of the two haloes causes the Lagrangian radii to expand. At the time of the maximum separation (marked with a cross) the halo of Leo IV is just outside the 90% mass-radius and, as shown in the left panel, is still within the expanded and deformed halo of Leo V. In some sense, this matches the original distance criterion, which said that neither halo-centre should leave the other halo.
4. Discussion and conclusions
We have presented possible scenarios for a twin system consisting of the faint dwarf spheroidal galaxies Leo IV and Leo V. The simulations were performed using a simple two-body code to rapidly find the solutions in the vast parameter space and the results were verified using a full N-body code. From this we find the minimum DM masses required for the two galaxies to form a tightly bound pair.
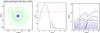 |
Fig. 3 Results of the full N-body simulation of case 4a (the case with the largest discrepancy between the two-body and full N-body result). In the left panel the surface-density contours of the Leo V halo are shown. The (red) cross marks the position of the centre of Leo IV. The inner five (black) contours are between 26−10 M⊙ pc-2, and the next five (blue) are between 10 and 1 and the outermost five (green) contours are between 1 and 0.1. Middle panel: the solid (black) line shows the distance between the two haloes. The (red) horizontal line is the maximum distance from the two-body result. The right panel shows the Lagrangian radii (10, 20, 30, ...90 per cent of the mass) of the two haloes; (black) solid lines for Leo IV and dashed (blue) lines for Leo V. The horizontal (red) solid line shows again the distance criterion from the simple code. The (red) cross shows the maximum distance in the full simulation and vertical dashed (red) line marks the time of maximum separation. |
The parameter space is restricted by assuming two independent DM haloes orbiting each other. Two perfectly shaped haloes would only be seen before the first close passage. This is a strong simplification of the real geometry of the problem. But as our results show (i.e. the comparison with the real N-body simulations), the resulting error of this simplification is in the order of 5–20% and therefore much smaller than the mass-range of our results, stemming from e.g. the unknown tangential velocity.
Another restriction is the maximum distance criterion we adopt. We find this criterion sensible given the satellites’ large distances from the MW. Smaller maximum separations would lead to higher required masses for the system to be bound. Larger separations would lead to lower masses, but since the expected tidal radius of the system (with respect to the gravitational force of the MW) is of the order of our distance criterion, we feel confident with our choice.
Because our distance criterion is of the order of the tidal radius, we are able to simplify even more and treat the system of the two dwarfs as isolated (i.e. we do not simulate the potential of the MW). Our aim is to determine whether the two galaxies are bound now (and we make no predictions about their future or past), therefore, we do not need to take their orbit around the MW into account.
We adopt two cases for the relative velocity. In one the restriction is that the measured difference in radial velocity is the only relative velocity the dwarfs have. In the other case the two satellites are given an additional tangential velocity of the same magnitude as the radial velocity.
We also adopt two mass ratios. First, mass-follows-light, i.e. the two haloes have a mass ratio of 1.8 like the luminous components. Second, mimicking the fact (as claimed by Walker et al. 2009b) that almost all dSph galaxies reside in DM haloes of the same minimum mass (i.e. a minimum halo mass to carry a luminous component), we adopt a mass ratio of 1.0. Moreover, to span the full range of proposed concentrations for dwarf galaxy dark haloes we consider three values for the concentration c = 5,10,20.
If we assume that the bound system consists of two DM haloes orbiting each other, we infer masses of about 1.7−2.1 × 10¹⁰ M⊙ for the whole system. If we add an additional tangential velocity, which cannot be observationally verified, we obtain ≈ 4.2−5.4 × 10¹⁰ M⊙. These are indeed very high masses for the two faint satellites and would put them amongst the most DM-dominated objects known. Still, these results do not infer that the scenario is impossible.
Another point to take away is that if we add the same amount of relative velocity tangentially, i.e. increasing the total relative velocity by a factor  , the required mass more than doubles. This shows quite a strong dependence on the relative velocity. Still, if we double the tangential velocity, the mass would vary within an order of magnitude, an uncertainty that we find in our results anyway.
We compute the DM mass within the adopted optical radius of Simon & Geha (2007) for Leo IV (i.e. 97 pc) and find that the M/L-ratios we obtain span the observationally (measured velocity dispersion) derived results. Our results also agree with the measured velocity dispersion of Leo V (Walker et al. 2009a) and the inferred dynamical mass. Taking the observations at face value, our results could, therefore, restrict the possible concentrations of the real DM haloes, once we know their relative tangential velocity.
Furthermore, we checked our results against the trend for dSph galaxies published by Wilkinson et al. (2006). They give the M/L-ratios within a radius of 300 pc (also seen in Walker et al. 2009b). Our simulations predict M/L-ratios, using the same radius, in the range log 10M / L = 2.5−3.7. These values are high but encompass the predictions for faint dSph galaxies, if we extrapolate the known values to the magnitudes of the Leos.
Comparing the results of our two-body code with full N-body simulations we find differences in the maximum separations of only a few per cent in most of the simulations. Only the simulations with equal mass haloes and additional tangential velocity have fairly large discrepancies. Because the mass of an NFW halo increases with radius, proportional to ln(r), the uncertainty in the masses is much lower. The simple integration programme used cannot predict any deformations of the haloes caused by their mutual interactions. In the full simulations we see those deformations and, even though the initial distance criterion is not fulfilled anymore, the haloes still stay within the deformations of the other. In that sense the distance criterion is still obeyed.
Our final remark is that we aim to search for the necessary total dark matter mass of the pair of satellites to ensure that they are bound to each other. Even though the comparison between the simple code and the full N-body results deviate somewhat from our distance criterion, they do not change the conclusions of the simulations. A bound pair in the restricted case is still a bound pair in the full simulations. Just by looking at our different cases (i.e. radial velocity only or radial plus tangential velocity) our results differ by about half an order of magnitude in total mass. In that respect a mass uncertainty of even 20–30 per cent does not change the conclusions of this paper, nor would it significantly alter the inferred M/L-ratios.
Summing up, assuming that the two Leos do, in fact, consist of a tightly bound pair, we find their inferred dark matter masses to be high but still within reasonable values. Therefore, it is possible that the two galaxies form a bound pair, making them an ultra-faint counterpart of the Magellanic Clouds.
Acknowledgments
M.F. acknowledges funding through FONDECYT grant 1095092 and BASAL. R.S. is funded through a Comite Mixto grant.
References
- Belokurov, V., Zucker, D. B., Evans, N. W., et al. 2006, ApJ, 647, L111 [NASA ADS] [CrossRef] [Google Scholar]
- Belokurov, V., Zucker, D. B., Evans, N. W., et al. 2007, ApJ, 654, 897 [NASA ADS] [CrossRef] [Google Scholar]
- Belokurov, V., Walker, M. G., Evans, N. W., et al. 2008, ApJ, 686, L83 [NASA ADS] [CrossRef] [Google Scholar]
- Boylan-Kolchin, M., Springel, V., White, S. D., Jenkins, A., & Lemson, G. 2009, MNRAS, 398, 1150 [NASA ADS] [CrossRef] [Google Scholar]
- Coleman, M. G., de Jong, J. T. A., Martin, N. F., et al. 2007, ApJ, 668, L43 [NASA ADS] [CrossRef] [Google Scholar]
- Fellhauer, M., Kroupa, P., Baumgardt, H., et al. 2000, NewAst., 5, 305 [Google Scholar]
- Fellhauer, M., Evans, N. W., Belokurov, V., et al. 2007, MNRAS, 375, 1171 [NASA ADS] [CrossRef] [Google Scholar]
- Fellhauer, M., Wilkinson, M. I., Evans, N. W., et al. 2008, MNRAS, 385, 1095 [NASA ADS] [CrossRef] [Google Scholar]
- Geha, M., Willman, B., Simon, J. D., et al. 2009, ApJ, 692, 1464 [NASA ADS] [CrossRef] [Google Scholar]
- Jin, S., Martin, N., de Jong, J., et al. 2012, Proc. Subaru conference on Galactic Archaeology, Shuzenji, Japan (Nov. 1–4, 2011), in press [arXiv:1201.5399] [Google Scholar]
- de Jong, J. T. A., Harris, J., Coleman, M. G., et al. 2008, ApJ, 680, 1112 [NASA ADS] [CrossRef] [Google Scholar]
- de Jong, J. T. A., Martin, N. F., Rix, H.-W., et al. 2010, ApJ, 710, 1664 [NASA ADS] [CrossRef] [Google Scholar]
- Kirby, E. N., Simon, J. D., Geha, M., Guhathakurta, P., & Frebel, A. 2008, ApJ, 685, L43 [NASA ADS] [CrossRef] [Google Scholar]
- Klypin, A., Kravtsov, A. V., Valanzuela, O., & Prada, F. 1999, ApJ, 522, 82 [Google Scholar]
- Koch, A., Wilkinson, M. I., Kleyna, J. T., et al. 2009, ApJ, 690, 453 [NASA ADS] [CrossRef] [Google Scholar]
- Koposov, S., Belokurov, V., Evans, N. W., et al. 2008, ApJ, 686, 279 [NASA ADS] [CrossRef] [Google Scholar]
- Kuhlen, M., Diemand, J., Madau, P., & Zemp, M. 2008, J. Phys. Conf. Ser., 125, 1 [CrossRef] [Google Scholar]
- Lokas, E. L., & Mamon, G. A. 2001, MNRAS, 321, 155 [NASA ADS] [CrossRef] [Google Scholar]
- Macciò, A. V., Dutton, A. A., & van den Bosch, F. C. 2009, MNRAS, 391, 1940 [Google Scholar]
- Macciò, A. V., Kang, X., Fontanot, F., et al. 2010, MNRAS, 402, 1995 [NASA ADS] [CrossRef] [Google Scholar]
- Metz, M., Kroupa, P., & Libeskind, N. I. 2008, ApJ, 680, 287 [NASA ADS] [CrossRef] [Google Scholar]
- Metz, M., Kroupa, P., & Jerjen, H. 2009, MNRAS, 394, 1529 [Google Scholar]
- Moore, B., Ghigna, S., Governato, F., et al. 1999, ApJ, 524, L19 [Google Scholar]
- Moretti, M. I., Dall’Ora, M., Ripepi, V., et al. 2009, ApJ, 699, L125 [NASA ADS] [CrossRef] [Google Scholar]
- Muñoz, R. R., Majewski, S. J., & Johnston, K. V. 2008, ApJ, 679, 346 [NASA ADS] [CrossRef] [Google Scholar]
- Navarro, J. F., Frenk, C. S., & White, S. D. M. 1997, ApJ, 490, 493 [NASA ADS] [CrossRef] [Google Scholar]
- Pawlowski, M. S., Kroupa, P., & de Boer, K. S. 2011, A&A, 523, 118 [Google Scholar]
- Sand, D. J., Olszewski, E. W., Willman, B., et al. 2009, ApJ, 704, 898 [NASA ADS] [CrossRef] [Google Scholar]
- Sand, D. J., Seth, A., Olszewski, E. W., et al. 2010, ApJ, 718, 530 [NASA ADS] [CrossRef] [Google Scholar]
- Simon, J. D., & Geha, M. 2007, ApJ, 670, 313 [NASA ADS] [CrossRef] [Google Scholar]
- Simon, J. D., Frebel, A., McWiliam, A., Kirby, E. N., & Thompson, I. B. 2010, ApJ, 716, 446 [NASA ADS] [CrossRef] [Google Scholar]
- Spinnato, P. F., Fellhauer, M., & Portegies Zwart, S. F. 2003, MNRAS, 344, 22 [NASA ADS] [CrossRef] [Google Scholar]
- Walker, M. G., Belokurov, V., Evans, N. W., et al. 2009a, ApJ, 694, L144 [NASA ADS] [CrossRef] [Google Scholar]
- Walker, M. G., Mateo, M., Olszewski, E. W., et al. 2009b, ApJ, 704, 1274 [NASA ADS] [CrossRef] [Google Scholar]
- Walsh, S. M., Jerjen, H., & Willman, B. 2007, ApJ, 662, L83 [NASA ADS] [CrossRef] [Google Scholar]
- Willman, B., Dalcanton, J. J., Martinez-Delgado, D., et al. 2005, ApJ, 626, L85 [NASA ADS] [CrossRef] [Google Scholar]
- Wilkinson, M. I., Kleyna, J. T., Gilmore, G. F., et al. 2006, Msngr, 124, 25 [Google Scholar]
- Zucker, D. B., Belokurov, V., Evans, N. W., et al. 2006a, ApJ, 643, L103 [NASA ADS] [CrossRef] [Google Scholar]
- Zucker, D. B., Belokurov, V., Evans, N. W., et al. 2006b, ApJ, 650, L41 [NASA ADS] [CrossRef] [Google Scholar]
All Tables
Mass-range of the haloes of cases 1a–3a and 4a–6a (which encompass the range of our results) within a radius of Leo IV of 97 pc, for which an observationally based estimate of the mass exists (Simon & Geha 2007).
All Figures
|
Fig. 1 Minimum DM mass of the total system Mtot versus concentration of the haloes. We plot 1 / c in favour of c to include the point-mass results at 1 / c = 0 (cases 0a, b; plotted as open and filled circle – blue online). Solid lines are the results using the mass-ratio of 1.8. Triangles are cases with radial velocity only and tri-stars with additional tangential velocity. Dashed lines show the results of equal mass haloes. Squares are radial-velocity-only cases and crosses have additional tangential velocity. |
| In the text | |
|
Fig. 2 Mass-to-light ratios within a radius of 300 pc. The circles are the dSph galaxies of the Local Group as reported by Wilkinson et al. (2006). For Leo IV, the filled upside-down triangles are cases 1a and 3 (concentrations c = 5 and c = 20 respectively) with radial velocities only. The open triangles are cases 4a and 6 (c = 5 and c = 20) with radial and tangential velocities. For Leo V we plot the values of cases 1 and 3a as well as 4 and 6a, respectively. We use these specific cases because they span the whole range of our results. |
| In the text | |
|
Fig. 3 Results of the full N-body simulation of case 4a (the case with the largest discrepancy between the two-body and full N-body result). In the left panel the surface-density contours of the Leo V halo are shown. The (red) cross marks the position of the centre of Leo IV. The inner five (black) contours are between 26−10 M⊙ pc-2, and the next five (blue) are between 10 and 1 and the outermost five (green) contours are between 1 and 0.1. Middle panel: the solid (black) line shows the distance between the two haloes. The (red) horizontal line is the maximum distance from the two-body result. The right panel shows the Lagrangian radii (10, 20, 30, ...90 per cent of the mass) of the two haloes; (black) solid lines for Leo IV and dashed (blue) lines for Leo V. The horizontal (red) solid line shows again the distance criterion from the simple code. The (red) cross shows the maximum distance in the full simulation and vertical dashed (red) line marks the time of maximum separation. |
| In the text | |
Current usage metrics show cumulative count of Article Views (full-text article views including HTML views, PDF and ePub downloads, according to the available data) and Abstracts Views on Vision4Press platform.
Data correspond to usage on the plateform after 2015. The current usage metrics is available 48-96 hours after online publication and is updated daily on week days.
Initial download of the metrics may take a while.