Fig. 1
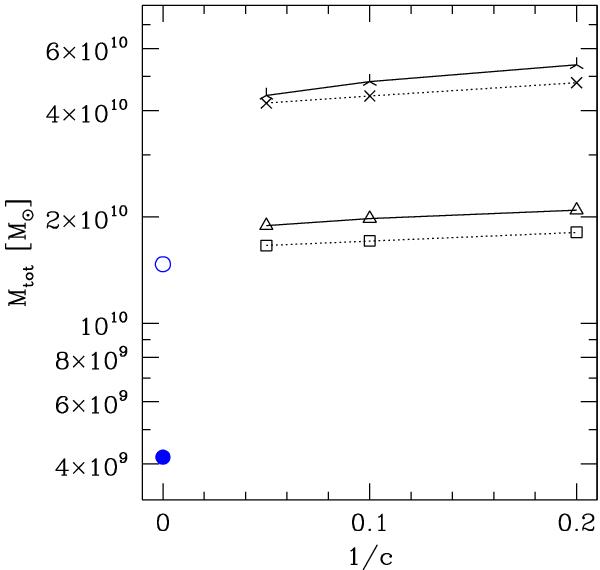
Minimum DM mass of the total system Mtot versus concentration of the haloes. We plot 1 / c in favour of c to include the point-mass results at 1 / c = 0 (cases 0a, b; plotted as open and filled circle – blue online). Solid lines are the results using the mass-ratio of 1.8. Triangles are cases with radial velocity only and tri-stars with additional tangential velocity. Dashed lines show the results of equal mass haloes. Squares are radial-velocity-only cases and crosses have additional tangential velocity.
Current usage metrics show cumulative count of Article Views (full-text article views including HTML views, PDF and ePub downloads, according to the available data) and Abstracts Views on Vision4Press platform.
Data correspond to usage on the plateform after 2015. The current usage metrics is available 48-96 hours after online publication and is updated daily on week days.
Initial download of the metrics may take a while.