Fig. 3
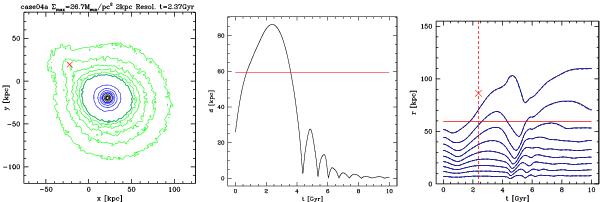
Results of the full N-body simulation of case 4a (the case with the largest discrepancy between the two-body and full N-body result). In the left panel the surface-density contours of the Leo V halo are shown. The (red) cross marks the position of the centre of Leo IV. The inner five (black) contours are between 26−10 M⊙ pc-2, and the next five (blue) are between 10 and 1 and the outermost five (green) contours are between 1 and 0.1. Middle panel: the solid (black) line shows the distance between the two haloes. The (red) horizontal line is the maximum distance from the two-body result. The right panel shows the Lagrangian radii (10, 20, 30, ...90 per cent of the mass) of the two haloes; (black) solid lines for Leo IV and dashed (blue) lines for Leo V. The horizontal (red) solid line shows again the distance criterion from the simple code. The (red) cross shows the maximum distance in the full simulation and vertical dashed (red) line marks the time of maximum separation.
Current usage metrics show cumulative count of Article Views (full-text article views including HTML views, PDF and ePub downloads, according to the available data) and Abstracts Views on Vision4Press platform.
Data correspond to usage on the plateform after 2015. The current usage metrics is available 48-96 hours after online publication and is updated daily on week days.
Initial download of the metrics may take a while.