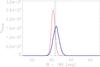
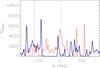
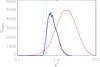
Fig. 3
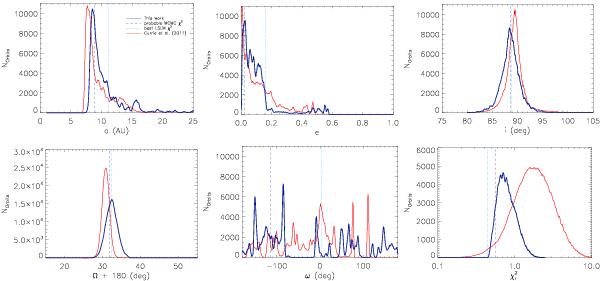
Results of the MCMC fit of the astrometric data of β Pic b: statistical distribution of the orbital elements a (top left), e (top middle), i (top right), Ω (bottom left) and ω (bottom middle). We also show the distribution of  for the solutions obtained (bottom right). In each plot, the blue line show the results of our MCMC study. The dot-dashed line indicates the position of the best-fit LSLM model obtained, and the –dashed line shows the position of an example of highly probable orbits according to our MCMC study see (Table 3). The results of our MCMC study using the dataset of Currie et al. (2011) are indicated by a red line.
Current usage metrics show cumulative count of Article Views (full-text article views including HTML views, PDF and ePub downloads, according to the available data) and Abstracts Views on Vision4Press platform.
Data correspond to usage on the plateform after 2015. The current usage metrics is available 48-96 hours after online publication and is updated daily on week days.
Initial download of the metrics may take a while.