Fig. 2
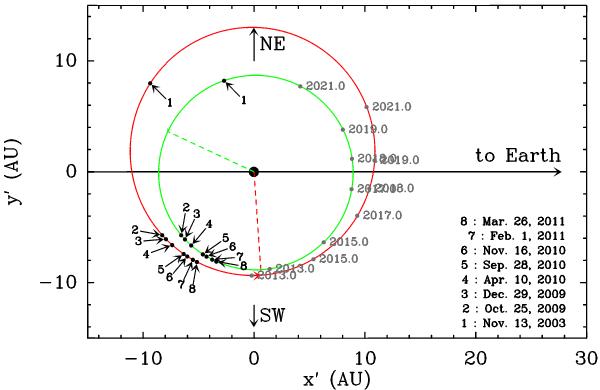
Plots ot the orbit of Table 3 with their orientation with respect to the line of sight. The larger orbit is the best LSLM χ2 model and the smaller one is an example of the highly probable orbit obtained with the MCMC approach. In each case, the dashed line shows the location of the periastron. The position of the planet at different observation epochs is shown as black dots along the orbit (projected error bars in the astrometric measurements are smaller than the symbol size), and predictions for the upcoming years are shown in gray.
Current usage metrics show cumulative count of Article Views (full-text article views including HTML views, PDF and ePub downloads, according to the available data) and Abstracts Views on Vision4Press platform.
Data correspond to usage on the plateform after 2015. The current usage metrics is available 48-96 hours after online publication and is updated daily on week days.
Initial download of the metrics may take a while.