Fig. A.1
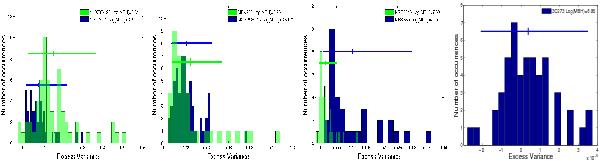
Distribution of the observed excess variances computed for 10 ks intervals for 3C 273. The distribution of each of the other 6 sources with longer XMM-Newton exposures are displayed on the online version of the paper. The points above each distribution indicate the average excess variance and the “error bars” around this mean indicate the mean upper and lower 90% confidence limits on  , estimated as described in the text. They are compatible with the region where ~90% of the points are located (see text for more details).
Current usage metrics show cumulative count of Article Views (full-text article views including HTML views, PDF and ePub downloads, according to the available data) and Abstracts Views on Vision4Press platform.
Data correspond to usage on the plateform after 2015. The current usage metrics is available 48-96 hours after online publication and is updated daily on week days.
Initial download of the metrics may take a while.