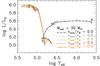
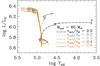
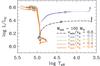
Fig. 1
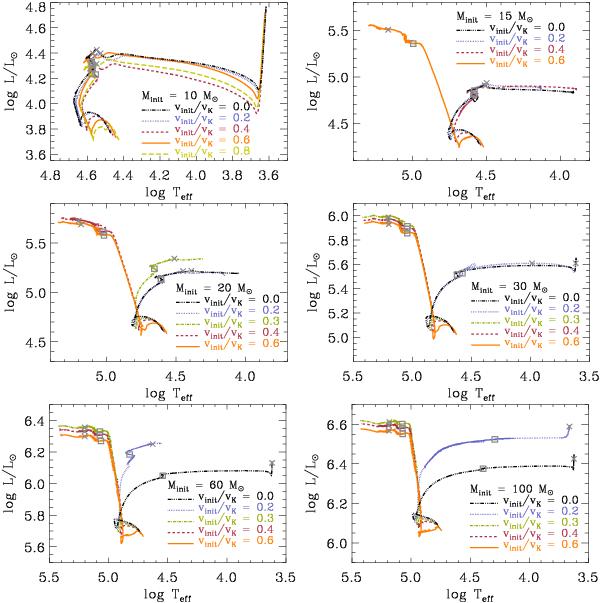
Evolution of the models in the HR diagram for 10, 15, 20, 30, 60 and 100 M⊙. Evolutionary tracks for different initial rotational velocities at a given initial mass are given in each panel as indicated by the labels. The end points of core hydrogen burning and core helium burning are marked by an square and a cross, respectively, on each evolutionary track.
Current usage metrics show cumulative count of Article Views (full-text article views including HTML views, PDF and ePub downloads, according to the available data) and Abstracts Views on Vision4Press platform.
Data correspond to usage on the plateform after 2015. The current usage metrics is available 48-96 hours after online publication and is updated daily on week days.
Initial download of the metrics may take a while.