Fig. 5
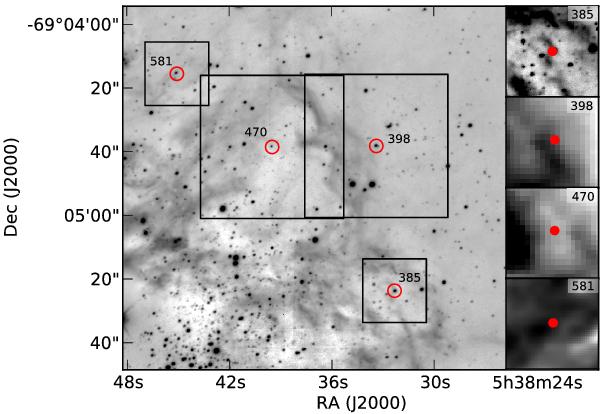
Filamentary structures possibly associated with the four candidates: VFTS 385, 398, 470 and 581 (red circles). The background image is from the VLT HAWK-I Ks band and the four subplots on the right are Ks, 70 μm, 70 μm and Hα/Hβ (Lazendic et al. 2003) maps for VFTS 385, 398, 470 and 581, respectively. The black boxes in the main image correspond to the field-of-view for the subplots on the right, where the 70 μm subplots are larger due to their lower resolution. Different stretches are used to highlight the filamentary associations in the subplots.
Current usage metrics show cumulative count of Article Views (full-text article views including HTML views, PDF and ePub downloads, according to the available data) and Abstracts Views on Vision4Press platform.
Data correspond to usage on the plateform after 2015. The current usage metrics is available 48-96 hours after online publication and is updated daily on week days.
Initial download of the metrics may take a while.