Fig. 11
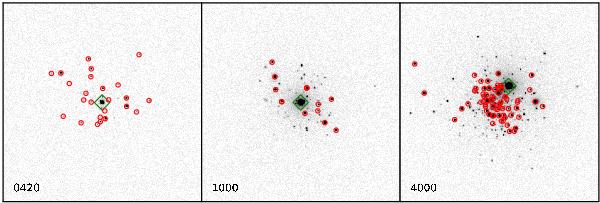
From left to right, the 5 × 5 pc (20″ × 20″) images of the simulated MASSCLEAN clusters of 420, 1000, and 4000 M⊙. The images were made of simulated clusters, with HST ACS resolution, at the distance of the LMC in the V-band. The green diamonds mark the brightest/most massive star in the cluster. The red circles indicate stars that would have been detected on the actual images (see Fig. 3). In all cases, the underlying cluster would have been detected.
Current usage metrics show cumulative count of Article Views (full-text article views including HTML views, PDF and ePub downloads, according to the available data) and Abstracts Views on Vision4Press platform.
Data correspond to usage on the plateform after 2015. The current usage metrics is available 48-96 hours after online publication and is updated daily on week days.
Initial download of the metrics may take a while.