Fig. 3
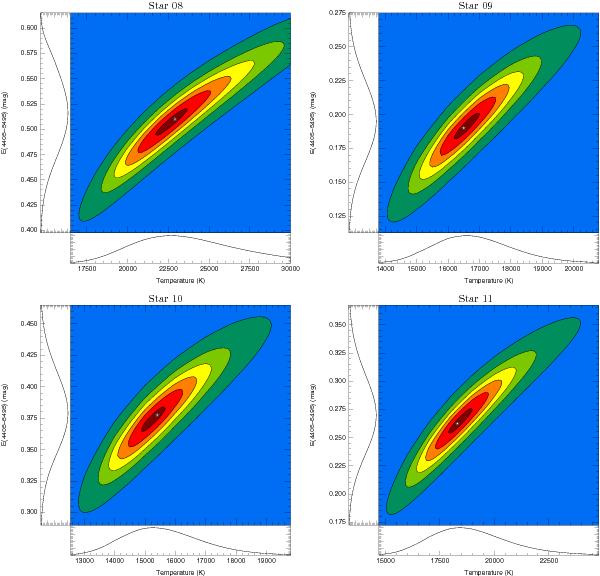
Contour plots showing the likelihood in the Teff-E(4405 − 5495) plane for the four stars in the second CHORIZOS run with the highest mean value for E(4405−5495). The contour intervals are linearly spaced with the minimum and maximum at 0.05 and 0.95 times the peak (mode) value, respectively. The star shows the location of the mode (not the mean) and the plots on each axis show the integrated likelihood for that parameter.
Current usage metrics show cumulative count of Article Views (full-text article views including HTML views, PDF and ePub downloads, according to the available data) and Abstracts Views on Vision4Press platform.
Data correspond to usage on the plateform after 2015. The current usage metrics is available 48-96 hours after online publication and is updated daily on week days.
Initial download of the metrics may take a while.