Fig. D.1
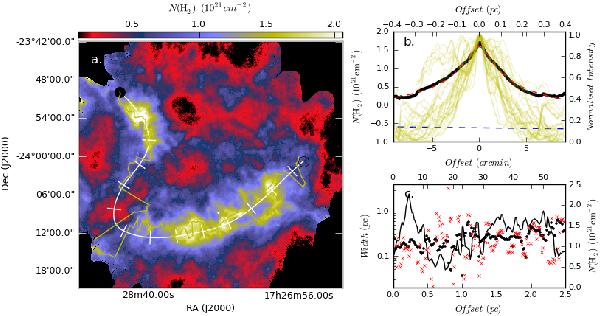
Properties of a filament in the field G1.94+6.07. The frame a shows the column density map. The white line shows the filament that was originally traced by eye and the yellow line follows the ridge that is formed by the peaks of the column density profiles in the perpendicular direction. The black filled circle indicates the start of the examined filament section. The tick marks are drawn at 5 arcmin intervals. The frame b shows the average column density profile of the filament (black line), as well as the Plummer profile (the red dashed line on top of the black line) that was fitted together with a linear baseline (the blue dashed line) over the range −0.4 pc to +0.4 pc. The yellow lines show individual column density profiles for 20% of the cuts with the highest column densities (values normalized to a peak value of one, the right hand scale). The frame c shows the FWHM values (the black circles) and the parameter Rflat of the Plummer fit (the red crosses), and the column density along the ridge of the filament (the solid line and the right hand scale) as a function of the distance along the filament.
Current usage metrics show cumulative count of Article Views (full-text article views including HTML views, PDF and ePub downloads, according to the available data) and Abstracts Views on Vision4Press platform.
Data correspond to usage on the plateform after 2015. The current usage metrics is available 48-96 hours after online publication and is updated daily on week days.
Initial download of the metrics may take a while.