Fig. 9
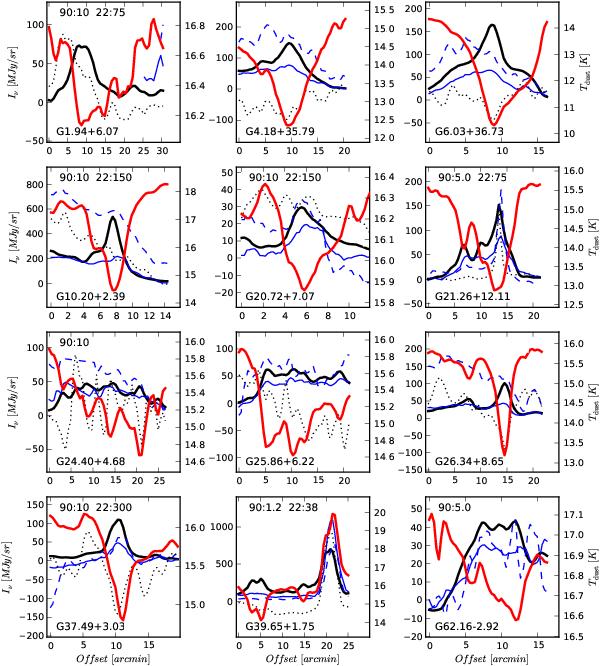
Cross sections of the surface brightness data along the lines indicated in Figs. 4, 5 and in the figures of Appendix A. The lines show the 250 μm SPIRE data (thick black line), AKARI 140 μm and 90 μm data (solid and dashed blue lines), and, when available, the WISE 22 μm data (dotted line). The average surface brightness in the reference region (see Fig. 4b) has been subtracted from the plotted values. The red thick line is the colour temperature. The data have been convolved to the resolution of one arc minute. The 90 μm data have been scaled by a factor 20 and the 22 μm data by a factor of 600. When a different scaling has been used, the wavelength and the multiplicative scaling factor are given in the frame (λ:factor). The plots for the other fields are shown in Appendix C.
Current usage metrics show cumulative count of Article Views (full-text article views including HTML views, PDF and ePub downloads, according to the available data) and Abstracts Views on Vision4Press platform.
Data correspond to usage on the plateform after 2015. The current usage metrics is available 48-96 hours after online publication and is updated daily on week days.
Initial download of the metrics may take a while.