Fig. 4
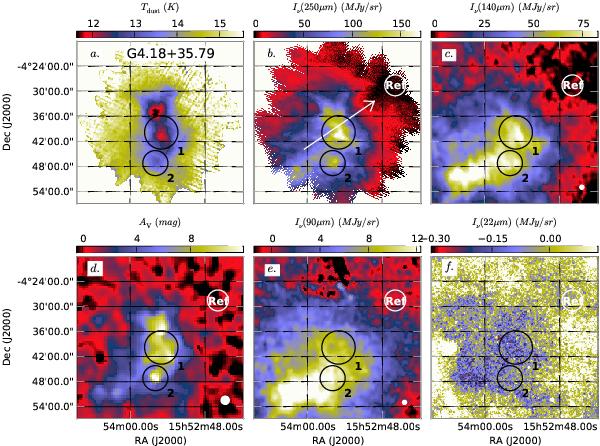
Selected observed and derived quantities for the field G4.18+35.79 (LDN 134). Shown are the colour temperature map derived from SPIRE data (frame a, 40″ resolution), the 250 μm SPIRE surface brightness map (frame b, 18″ resolution), the AKARI wide filter maps at 140 μm and 90 μm (frames c and e), the visual extinction AV derived from 2MASS catalog stars (frame d), and the WISE 22 μm intensity (frame f). For the other fields, see Appendix A. The respective beam sizes are indicated in the lower right hand corner of each frame. The positions of selected clumps (black circles; see Sect. 3.2.1) and the reference regions used for background subtraction (white circle; see Sect. 3.2.1) are also shown. In frame b, the arrow indicates the position of the stripe plotted in Fig. 9.
Current usage metrics show cumulative count of Article Views (full-text article views including HTML views, PDF and ePub downloads, according to the available data) and Abstracts Views on Vision4Press platform.
Data correspond to usage on the plateform after 2015. The current usage metrics is available 48-96 hours after online publication and is updated daily on week days.
Initial download of the metrics may take a while.