Fig. 3
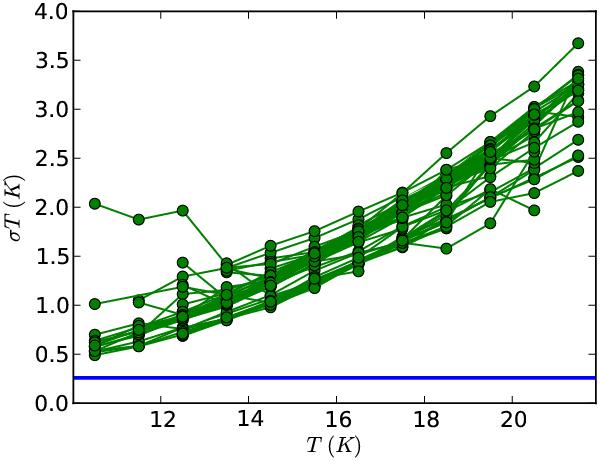
Uncertainty of the colour temperatures estimated with a Monte Carlo study. The curves show, for each field, the mean error of the temperature if the uncertainty of the surface brightness data were 13%. The horizontal line is the 1-σ value (calculated over all fields) of the bias associated with the uncertainty of the intensity scale zero points.
Current usage metrics show cumulative count of Article Views (full-text article views including HTML views, PDF and ePub downloads, according to the available data) and Abstracts Views on Vision4Press platform.
Data correspond to usage on the plateform after 2015. The current usage metrics is available 48-96 hours after online publication and is updated daily on week days.
Initial download of the metrics may take a while.