Fig. 15
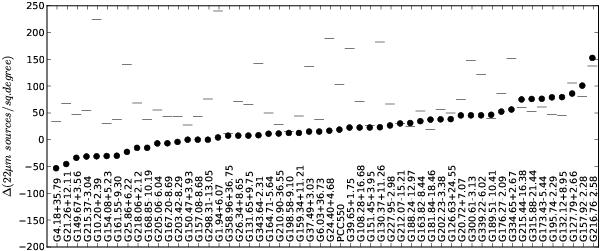
The fields sorted in increasing number density of the 22 μm sources in the high column density areas relative to the average source density of the field. The circles are the excess of sources per square degree. The horizontal dashes show the total source density, including both the high and the low column density areas.
Current usage metrics show cumulative count of Article Views (full-text article views including HTML views, PDF and ePub downloads, according to the available data) and Abstracts Views on Vision4Press platform.
Data correspond to usage on the plateform after 2015. The current usage metrics is available 48-96 hours after online publication and is updated daily on week days.
Initial download of the metrics may take a while.