Fig. E.1
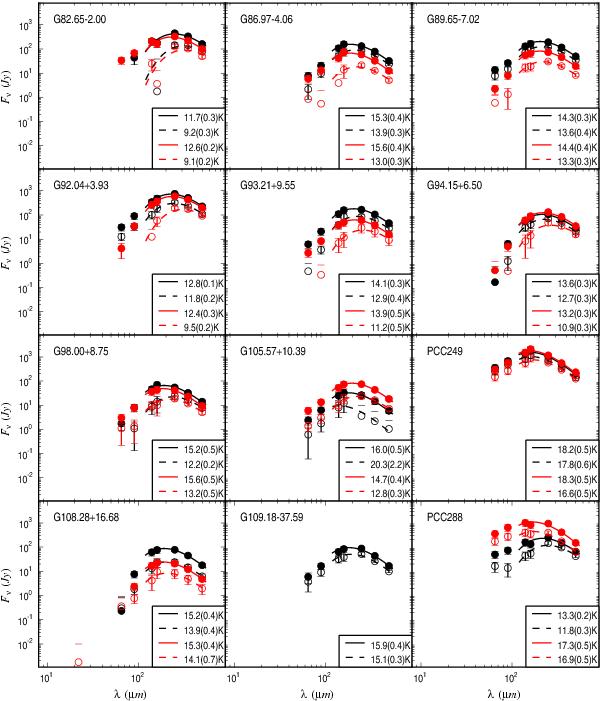
Spectral energy distributions corresponding to the apertures marked in the figures of Appendix A. The plots include 22 μm WISE data, AKARI data at 65 μm, 90 μm, 140 μm, and 160 μm, and the three SPIRE channels at 250 μm, 350 μm, and 500 μm. In most fields two aperture positions were chosen and the data for the second one are shown in red. The background subtraction was done using the reference areas marked in the figures of Appendix A (solid symbols) or by using a local annulus (open symbols). The colour temperatures from the modified blackbody fits with β = 2 are listed in the frames.
Current usage metrics show cumulative count of Article Views (full-text article views including HTML views, PDF and ePub downloads, according to the available data) and Abstracts Views on Vision4Press platform.
Data correspond to usage on the plateform after 2015. The current usage metrics is available 48-96 hours after online publication and is updated daily on week days.
Initial download of the metrics may take a while.