Fig. 12
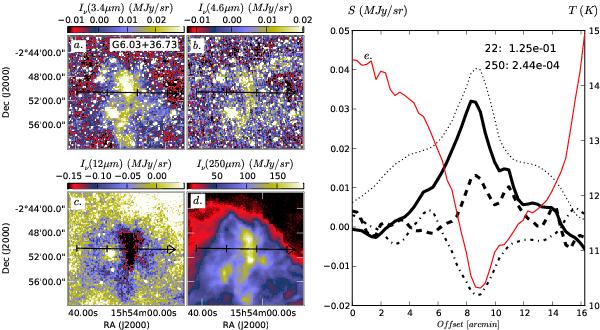
Evidence of coreshine in the field G6.03+36.73 (LDN 183). Shown are the WISE 3.4 μm, 4.6 μm, and 12 μm WISE maps (frames a–c) and the SPIRE 250 μm map (frame d). Frame e) shows surface brightness profiles along the arrow marked in the previous frames. The lines correspond to the 3.4 μm (solid line), 4.6 μm (dashed line), 12 μm (dash-dotted line), and 250 μm data (dotted line). The numbers in the upper right corner give the possible scaling applied to the data before plotting (λ:factor). The red line and the right hand scale show the colour temperature.
Current usage metrics show cumulative count of Article Views (full-text article views including HTML views, PDF and ePub downloads, according to the available data) and Abstracts Views on Vision4Press platform.
Data correspond to usage on the plateform after 2015. The current usage metrics is available 48-96 hours after online publication and is updated daily on week days.
Initial download of the metrics may take a while.