Fig. 11
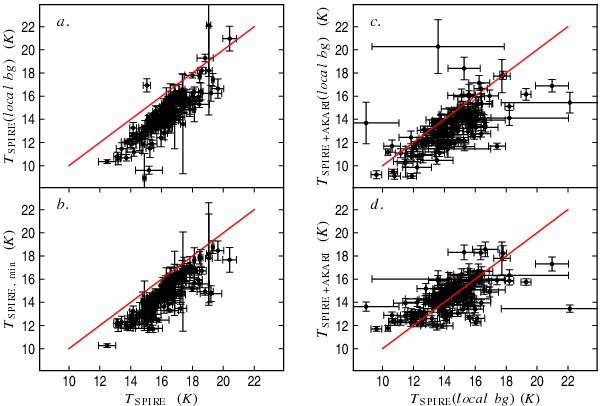
Comparison of the temperature estimates for the selected clumps. In the left hand frames, the x-axis is the temperature derived from the total surface brightness. This is correlated with the minimum values within the apertures (frame b) and the values obtained with a local background subtraction (frame a). In the right hand frames the SPIRE temperatures (with background subtraction) are compared with the values obtained using the combination of SPIRE and AKARI data (λ > 100 μm) and with (frame c) or without (frame d) the subtraction of the local background.
Current usage metrics show cumulative count of Article Views (full-text article views including HTML views, PDF and ePub downloads, according to the available data) and Abstracts Views on Vision4Press platform.
Data correspond to usage on the plateform after 2015. The current usage metrics is available 48-96 hours after online publication and is updated daily on week days.
Initial download of the metrics may take a while.