Fig. 1
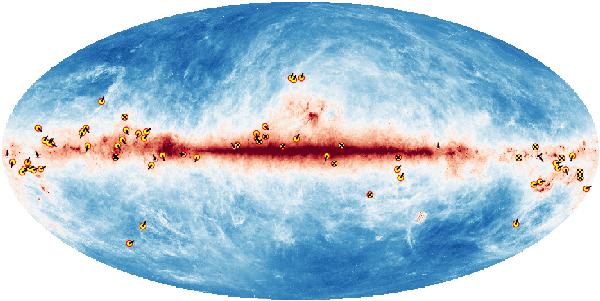
The locations of the observed fields. The background is the IRAS 100 μm map and the circles denote the positions of the fields. The arrows drawn on each circle indicate the distances, starting with 0 pc for the upright direction, one clockwise rotation corresponding to 2 kpc. The six sources with distances larger than 1.5 kpc are drawn with smaller symbols. The sources without reliable distance estimates are marked with crosses.
Current usage metrics show cumulative count of Article Views (full-text article views including HTML views, PDF and ePub downloads, according to the available data) and Abstracts Views on Vision4Press platform.
Data correspond to usage on the plateform after 2015. The current usage metrics is available 48-96 hours after online publication and is updated daily on week days.
Initial download of the metrics may take a while.